
Pi PMS (Process Monitoring System)

Overview
The Pi PMS is a portable on-line shape analyzer system that can serve as a temporary or dedicated system to monitor size, shape in real-time. The system is basically a combination of several Pi Sentinel PRO instruments, a state-of-the art dynamic image analyzers incorporated in analysis modules and controlled by a Master computer into a portable battery-operated control unit.
This system is perfect for applications where monitoring not just the diameter, but the shape of raw materials is vital for on-line processes. Ensuring the same morphology is crucial to ensure the efficacy of the final product in a number of industrial and pharmaceutical processes.
It is vital to utilize a high-resolution analytical tool that can supply as much information as possible about the crystals being formed over time. The Pi PMS has been designed to work where raw material manufacturing processes require real-time feedback to make critical process decisions.”

The Analysis Modules of the Pi PMS have been designed to operate where raw material manufacturing processes are occurring and require real-time feedback to make critical process decisions. In other words, the Pi PMS takes the sample for analysis directly from the reactor or process. The analysis of the raw material is performed “on-line”, next to the reactors and without any disruption or substantial modification of customer resources. Once analysis is completed, the Analysis Modules can be disconnected from that group of reactors and connected to a different group.

The performance of two or more instruments is supervised simultaneously by a master Touchscreen All-in-One computer on the top section of the control unit, via a wireless remote-control application to monitor the analysis of the raw materials directly over the reactors or process.
The system is driven by a powerful battery with an intelligent charger/controller to keep the battery fully charged all the time. Therefore, an un-interrupted duty cycle of 24/7/365 is expected.
Remote troubleshooting would also be available only if access to the system is granted by the process owner (a password is randomly generated and valid only for one time).
Control Unit
Upper section
The Upper section contains a Touchscreen All-in-One computer as a master computer + a display that controls the two wireless modules via remote-control application software.

Lower section
The Lower section contains the battery with the intelligent charger/controller as well as the inverter to provide power to the upper section of the tower.

Wireless Analysis Module
The wireless module contains a Microsoft Surface PRO 4 computer and a Pi Sentinel PRO instrument (modular version). This allows the monitoring of a process to occur autonomously while being monitored and controlled by the master computer.

Evolution of Process Control Methods
Traditional Process Control Method
Typical particle size systems are mostly used off-line or also called at-line where a sample must be taken from the process, prepared and analyzed prior to then reviewing the results and deciding on any change the process may have experienced.
For many years, this has been the normal and acceptable means of controlling a process. Laser Diffraction has typically been the tool of choice due to the simplicity of analysis. Laser Diffraction requires several parameters to be known such as refractive index to get accurate results. However, due to the relatively high sensitivity brought about by software and detector techniques, Laser Diffraction is ideal for checking and comparing lot-to-lot differences in a process enabling the end user to study and make decisions on what needs to change.
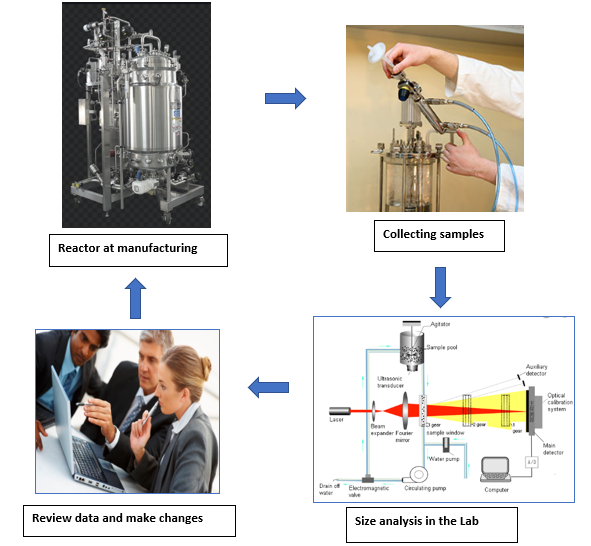
As an example, shown above, the process of collecting a sample from a Bioreactor, analyzing the sample and deciding of a process change, is slow and costly, causing waste and scrap of product and delays in production. This slow turn-around of process control info has forced many manufacturers toward producing in higher quantity. The trend toward smaller batch quantities to minimize waste, cost, has historically been more difficult due to the slow turnaround of process control feedback.
Current Process Control Method
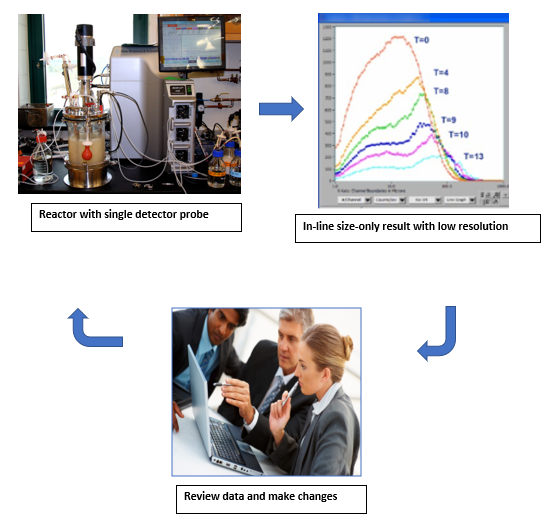
There have been some on-line and in-line systems developed in the past, but most of them have been low-resolution techniques that are not capable of giving the end user a high level of confidence of the raw material particle size and shape. These low-resolution techniques generally will only be useful if the process is very out of control, at which point, detection is useless. As an example, off-line Laser Diffraction systems are generally high resolution and can detect small shifts in raw material size. This comes from having anywhere from about one hundred to several hundred detectors for high sensitivity. In-line probe-based methods tend to have from one (1) to a few detectors, making the identification of a process change very difficult, unless a significant change occurs by which time is too late to save the process thus causing waste.
Dynamic Image Analysis
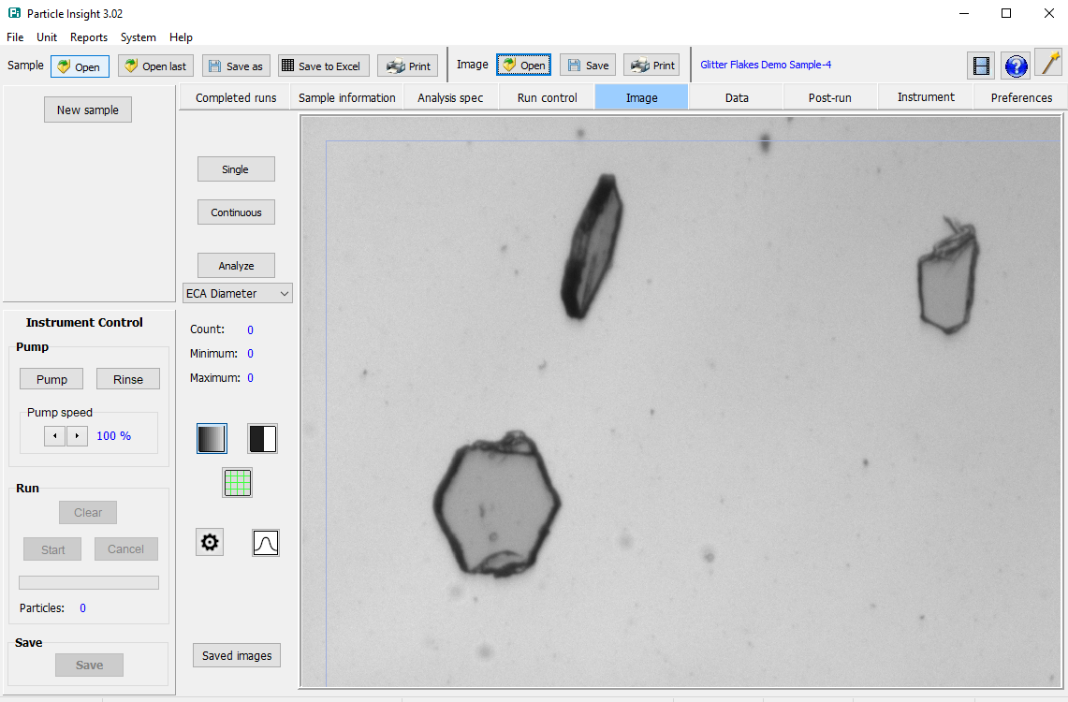
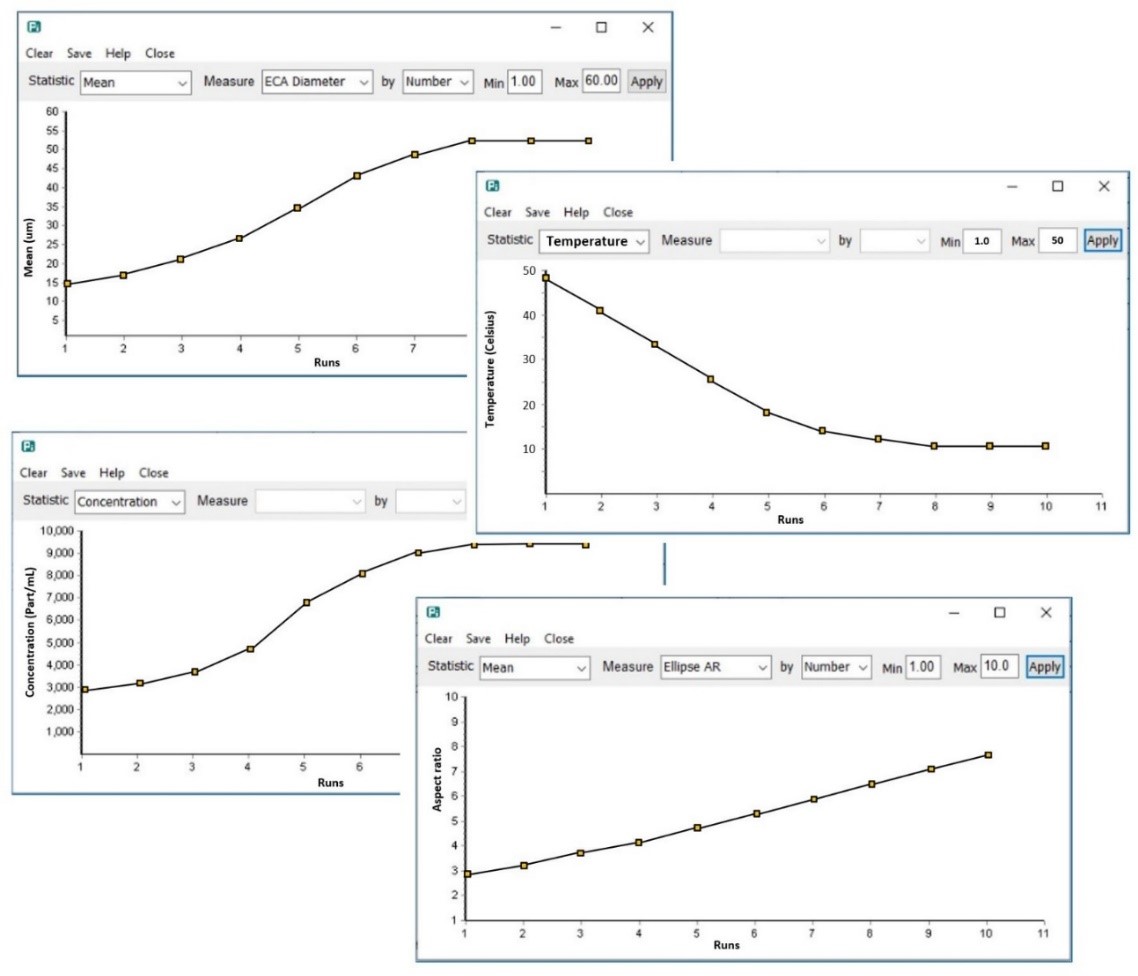
With new techniques coming into the market, industry has come to understand the value of Dynamic Image Analysis. Not only does Dynamic Image Analysis give high resolution traditional size information, it also gives extensive shape information. This added feature, along with images of all measured particles, allows end users to have high resolution process change information as well as the ability to differentiate different populations in a sample, such as what percentage of an Active Pharmaceutical Ingredient (API) vs what percentage of excipient is in a sample. Dynamic Image analysis has also been adapted to an on-line process tool and allows to see real-time process changes and track parameters over time such as size, aspect ratio, concentration, temperature changes and other measurements as they happen, using the Time Series Chart feature.

How the Particle Insight and Shape Module have been implemented in the big companies
Phase 1: Pi next to laser system
Some Pharmaceutical companies ran their Stand-Alone Particle Insight systems next to their Size-Only laser system to gather additional information such as Circularity, Aspect Ratio, etc. not available with those traditional methods.

Phase 2: Pi Shape Module direct connected to laser systems
Later, the Particle Insight Shape Module (Pi SM) was directly connected to a laser system to run the exact same sample. Now the error of preparing a sample twice was removed and the relationship between shape and size was better understood. In the case of Pharmaceuticals, the kinetics of size a and shape in crystal growth was better defined.

Phase 3: Implementation of a remote monitoring system
Since the Particle Insight was proven to be a trusted means to monitor in-process customer requirements, the final phase of deployment was to develop a flexible portable solution that could be used in the manufacturing environment for real-time feedback. Dynamic Image analysis has been shown to be a high-resolution technique for size as well as shape. Until now, it was difficult to obtain detailed shape information and images of every measured particle to make quality determination and decisions on a process. Moving this technique from at-line to on-line was a natural progression.

The March Toward In-Process Control and Continuous Manufacturing
Pharmaceutical companies early on saw the advantages of comparing particle dynamic particle shape images with laser API crystal size data to understand which variables maximize API crystal growth, purity, flowability, and compact ability. API crystal technology was limited to batch reactors and offline measurements by gathering equivalent circular diameter laser data as feedback to manage the crystallization process. The objective was to minimize the lag time to make measurements and affect the crystallization process variables in real time. If not done properly and quickly, API crystal growth could be erratic and produce crystal size ranges too large that needed to be subsequently milled to control crystal size ranges needed to predict downstream blending and tableting.
Finally, the Pi PMS (Process Monitoring System) comes to solve these limitations other size-only methods have by offering the possibility to see real-time process changes and track parameters over time such as size, aspect ratio, concentration, temperature, and other measurements as they occur, using the Time Series Chart feature.
This new feature allows the evaluation of behavior from particles suspended in a solution by plotting results of pre-selected measures and statistics from a collection of run files over a period of time under same conditions. The charts created for each combination of parameters reflects the behavior of particles and can be used in different application and processes like dissolution and crystallization in pharmaceutical industries.
Benefits of the Pi PMS (Process Monitoring System)
Portability
The Pi PMS is designed as a mobile system that allows the end user to wheel the system to any area of the manufacturing floor or to the research departments and attach any module to a process temporarily or for an extended period.

Battery backup operation
The Pi PMS is designed to work while on battery power mode allowing continued operation (approx. 2 hours) even if a power outage occurs.

Connectivity configuration
The Pi PMS is configurable, so it can manage by default 2 wireless Analysis modules, or expandable up to 4 wireless Analysis modules simultaneously. Wireless Analysis modules can be installed at any process for walk-away operation. These modules also contain battery backup systems to ensure continued operation even if a power outage occurs or even if communication is lost temporarily with the Pi PMS system.

Keep in mind, being an on-line system, detachment of the Pi PMS modules does not disrupt the process unlike other probe-based methods. This means that the reactor and its contents will not be compromised by the measurement module.
Pi PMS New Features
As a new generation of the traditional Particle Insight instrument, the new features are:
- Improved optics. All components related to image capture (camera and Lens) have been noticeably improved, including easier magnification configuration. Higher speed data transfer rate improves real-time analysis.
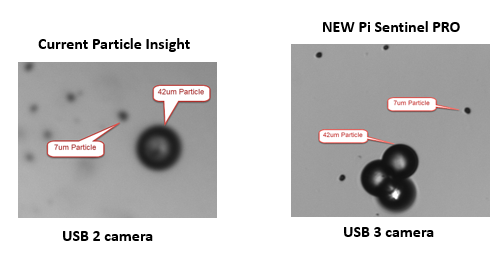
- Improved images. Higher resolution and image capture for better edge definition.
- Improved accuracy. Better accuracy and ability to differentiate minor differences in particle shape down to one micron.
- Improved resolution. High resolution digital camera with up to 5 MPs resolution and higher speed data transfer rate and capable of taking up to 127 frames per second rated, captures live images of thousands of particles.
- Improved fluidics. New fluidic design to improve sample suspension and organic solvent compatibility and reliability.
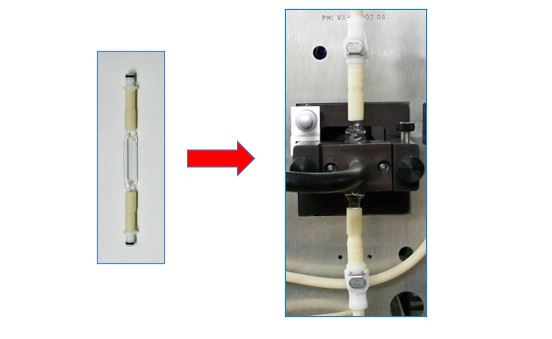
- Improved Sample Cell assembly. The Quartz sample cell has been implemented with quick connectors (body and insert) to facilitate easy removal for cleaning purposes or replacement.
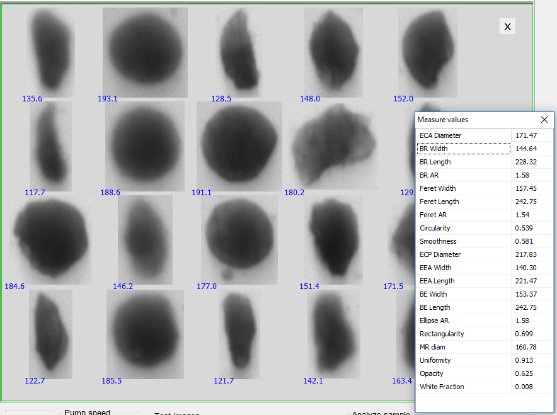
- Improved thumbnail features. When viewing particle thumbnails, the left-mouse button will display all the shape measurement values for that selected thumbnail, the right-mouse button will allow the user to eliminate that specific particle from the database and statistics. Useful when, for example, a single air bubble is not wanted in the database.
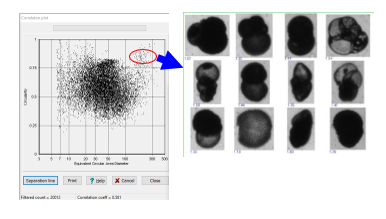
- Improved correlation plot features. Correlation Plot now, able to view thumbnails directly from correlation plot area of interest.
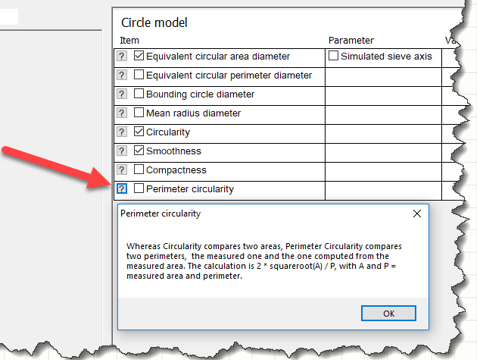
- New perimeter measure. A second Circularity measure was developed called “Perimeter Circularity” to assist customers with existing FPIA systems who have data using this different Circularity measure.
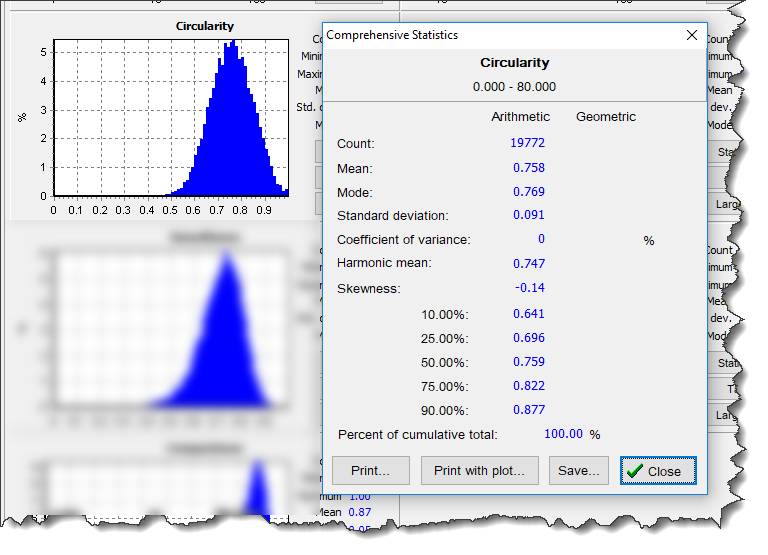
- New 3 digits resolution. Circularity and ALL other fraction measures have data reported with 3-decimal place accuracy. A requirement for transition from FPIA data to Pi Sentinel PRO data.
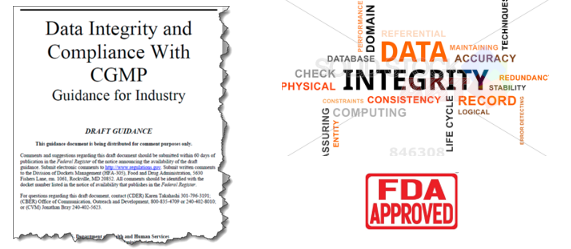
- New instrument Certification program. A Qualification Program using NIST traceable samples is available to certify the system annually and contains all the data required and paperwork to be ready for FDA audits for compliance with 21CFR Part 11 as well as Data Integrity guidelines.
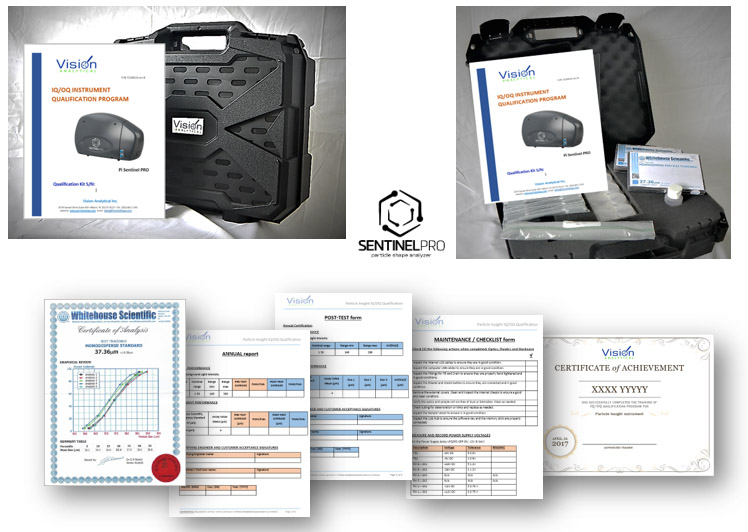
- New Data Integrity compliance. The Certification program complies to new Data Integrity FDA Guidance document.
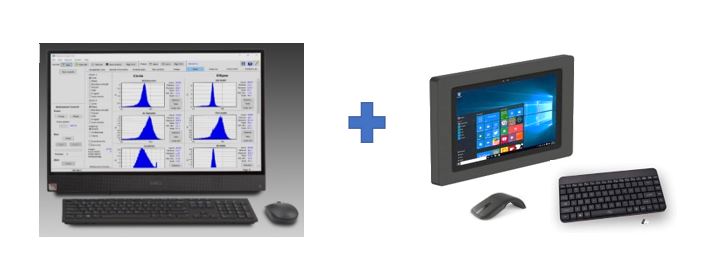
- New computing platform. Included with every system is a Touchscreen All-in-One computer for the master computer and a Microsoft Surface PRO for the wireless modules, allowing the customer more interaction with the software features.
- Notification to initiate an additional process. As critical shape parameters are met, the Pi PMS can provide an alarm signal or notification to initiate a separate required process.

- The reactor operation is not interrupted. Keep in mind, being an on-line system, detachment of the Pi PMS modules does not disrupt the process unlike other probe-based methods. This means that the reactor and its contents will not be compromised by the measurement module.
- New software interface. The software user interface has been changed to reduce the clutter of options presented to the user. The user still has all the options of the old Pi, they are just accessed differently.
- New Time series chart feature.. This feature allows the evaluation of behavior from particles suspended in a solution by plotting results of pre-selected measures and statistics from a collection of run files, over a period of time under similar conditions. The charts created for each combination of parameters reflects the behavior of particles and can be used in different application and processes like dissolution and crystallization in pharmaceutical industries.
Benefits of the Pi PMS:
As a result of the improvements, the benefits are:
- Higher speed data transfer rate, up to 127 frames per second rated digital camera with up to 5 MPs resolution, captures live images of thousands of particles.
- Over 30 shape parameters are recorded, including circularity, ellipticity, opacity, mean diameter, smoothness, aspect ratio, fiber length and many more
- All analyzed particles have thumbnail images saved for post-run viewing and shape analysis, both in grey scale and binary views.
- Ability to compare different analyses via histogram overlays for all analyzed shape parameters.
- Scatter plot correlates two shape measurements and can be utilized as a process quality control criterion as an at-line application within unit operations.
- Unique and powerful software permits the use to simplify data processing to a pass/fail reporting or choose to extend data analysis to a full suite of post processing image and shape analysis reports
- Allows the evaluation of behavior from particles suspended in a solution by plotting results of pre-selected measures and statistics from a collection of run files, over a period of time under same settings