
A Comparison Between Fines and Particle Size
Understanding the Impact of Fine Particles in Silicon Carbide Samples
In particle characterization, evaluating both particle size and the presence of fines is critical. This article compares two silicon carbide samples, F8 and F6, to demonstrate how fine particles affect overall particle size distribution (PSD). The analysis is powered by the Particle Insight Raptor — Vision Analytical’s latest and most advanced dynamic image analyzer.
Sample Overview
Silicon Carbide F8 Volume Distribution
-
ECA Diameter – Volume: 1.0 – 55.06 µm
-
Total Count: 20,057
-
Mean: 11.4 µm
-
Percentiles:
-
10%: 7.8 µm
-
25%: 9.0 µm
-
50% (Median): 10.6 µm
-
75%: 12.6 µm
-
90%: 15.0 µm
-
Silicon Carbide F8 Volume Distribution
ECA Diameter – Volume: 1.0 – 55.06 microns
| Total count | 20,057 |
| Mean | 11.4 microns |
| 10.00% | 7.8 microns |
| 25.00% | 9.0 microns |
| 50.00% | 10.6 microns |
| 75.00% | 12.6 microns |
| 90.00% | 15.0 microns |

Silicon Carbide F6 Volume Distribution
-
ECA Diameter – Volume: 1.0 – 55.06 µm
-
Total Count: 19,919
-
Mean: 16.4 µm
-
Percentiles:
-
10%: 10.6 µm
-
25%: 12.5 µm
-
50% (Median): 15.2 µm
-
75%: 18.8 µm
-
90%: 22.9 µm
-
Note: Sample F6 has a mean size approximately 44% larger than F8.
Silicon Carbide F6 Volume Distribution
ECA Diameter – Volume: 1.0 – 55.06 microns
| Total count | 19,919 |
| Mean | 16.4 microns |
| 10.00% | 10.6 microns |
| 25.00% | 12.5 microns |
| 50.00% | 15.2 microns |
| 75.00% | 18.8 microns |
| 90.00% | 22.9 microns |

Advanced Analysis Using the Particle Insight Raptor
The Particle Insight Raptor provides powerful tools for isolating and analyzing specific size ranges within a sample. This allows users to visually detect and quantify both oversized particles and fines — giving a much clearer understanding of what influences the sample’s PSD.
Oversized Particle Identification
Let’s examine particles larger than 30 microns:
-
Sample F8: 3 particles >30 µm
-
Sample F6: 36 particles >30 µm
These few but significantly larger particles in F6 can disproportionately shift the volume-based PSD.
Visualizing Particle Size Distributions
Volume-Based Overlay Comparison
Volume-based overlays emphasize how large particles influence distribution.
Even though both samples cover the same overall size range, sample F6’s larger particles stretch the upper end of the curve, raising the mean size.

Blue Line: Silicon Carbide F8 Red Line: Silicon Carbide F6
Number-Based Overlay Comparison
In contrast, a number-based view reduces the visual dominance of larger particles, showing the true particle count distribution.
Silicon Carbide F8 vs F6 Number Overlay

Blue Line: Silicon Carbide F8 Red Line: Silicon Carbide F6
This view makes it clear that large particles are rare in both samples — with F6 containing only a slightly higher count.
Focusing on Fines (<5 Microns)
Fines are particularly relevant for processing behavior, material packing, and performance.
Number-Based Overlay Below 5 Microns
This focused analysis reveals the significant difference in fines content.
Silicon Carbide F8 vs F6 Number Overlay Below 5 microns

Blue Line: Silicon Carbide F8 Red Line: Silicon Carbide F6
The following shows the captured statistics of each sample under 5 microns:
Silicon Carbide F8 Volume Distribution Below 5 microns
ECA Diameter – Number: 1.0 – 5.0 microns
| Total count | 25 |
| Mean | 2.9 microns |
| 10.00% | 1.1 microns |
| 25.00% | 1.3 microns |
| 50.00% | 1.6 microns |
| 75.00% | 4.8 microns |
| 90.00% | 5.0 microns |
Silicon Carbide F6 Volume Distribution Below 5 microns
ECA Diameter – Number: 1.0 – 5.0 microns
| Total count | 256 |
| Mean | 1.4 microns |
| 10.00% | 1.0 microns |
| 25.00% | 1.1 microns |
| 50.00% | 1.2 microns |
| 75.00% | 1.5 microns |
| 90.00% | 1.9 microns |
Conclusions and Takeaways
-
Fines Content: F6 has a significantly higher fines load, which can affect flow properties, filtration, and packing density.
-
Oversized Particles: Larger particles in F6 may skew volumetric metrics and mislead quality assessments.
-
Distribution Tightness: F8 shows a more uniform and tighter particle size spread — ideal for precision-demanding applications.
Why Use the Particle Insight Raptor?
The Particle Insight Raptor enables detailed investigation into both particle size and shape, along with automated statistical breakdowns of custom size ranges. This allows manufacturers, researchers, and quality control teams to detect even subtle variations in particle populations — a critical advantage over legacy particle sizers.
With its cutting-edge imaging engine and analytical software, the Raptor ensures that your particle data goes beyond averages — delivering insights that help solve real-world problems in materials science, pharmaceuticals, ceramics, abrasives, and more.
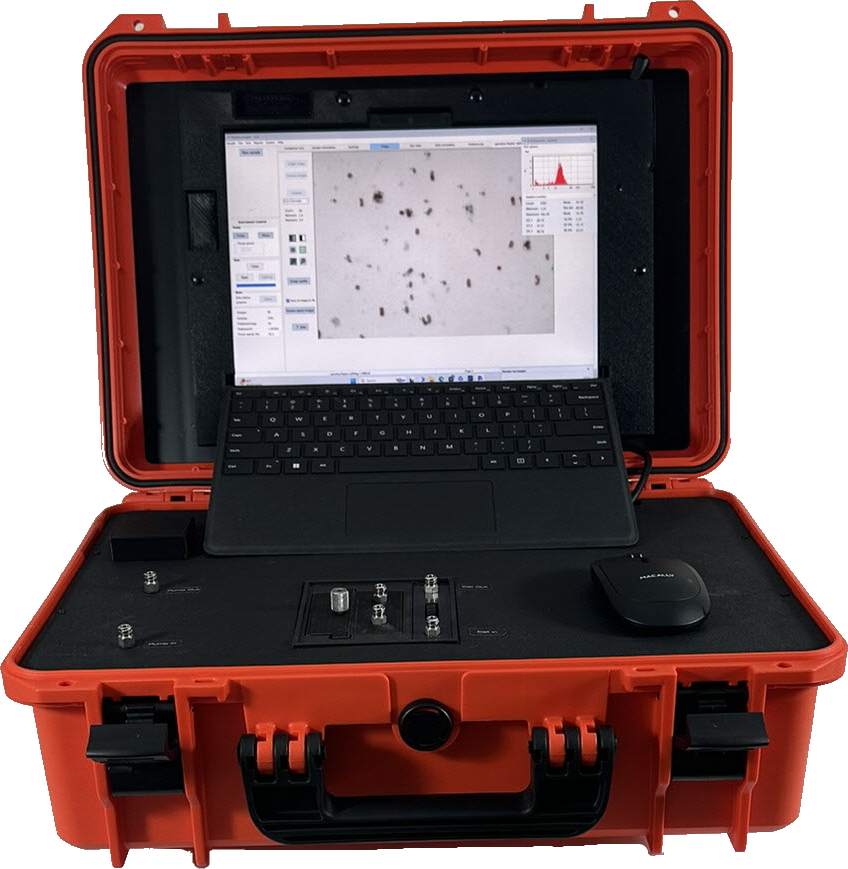
Pi Raptor Portable