
How do particle sizing techniques compare? Understand their strengths, limitations, and when to use each method for accurate results.
Fine particles are fundamental to the performance of both natural and engineered materials, affecting key processes such as dissolution, adsorption, and reaction rates. These behaviors depend on particle size, shape, surface area, and porosity—either as individual particles or agglomerates. Achieving optimal results requires controlling these properties, which begins with accurate measurement. However, different particle sizing techniques can yield different results, each with its own advantages and limitations. Choosing the wrong method can lead to misleading data and poor decision-making.
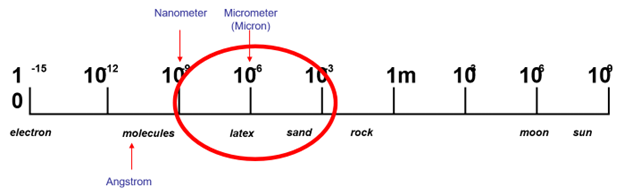
Most industrial particles fall into a similar size region shown below.
Also, as mentioned above, there are many techniques that can satisfy different applications if only comparing them by the size range they address.
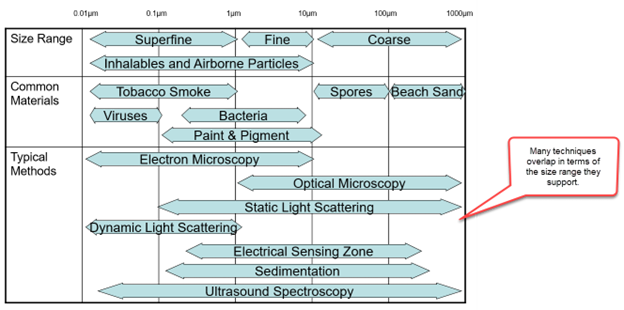
Because multiple techniques can measure similar particle size ranges, it is essential to understand their differences in order to select the most appropriate method for your application. In addition to size, other sample requirements must also be considered. For example, if particle count and concentration are important, specific techniques such as Dynamic Image Analysis, light blockage, and Electrical Sensing Zone (Coulter Principle) may be required. Similarly, whether a sample is analyzed in a wet (including organic) medium or a dry state can influence the choice of technique. There are many factors that determine the best method for particle analysis.
It is equally important to recognize that different techniques, while all reporting particle size, may produce different results. In some cases—particularly with irregularly shaped particles—these differences can be significant. This does not mean one technique is correct and another is wrong; rather, each measures particle size in a different way. To illustrate this, a study was conducted in collaboration with Vision Analytical, Micromeritics Instrument Corporation, and MVA Scientific Consultants.
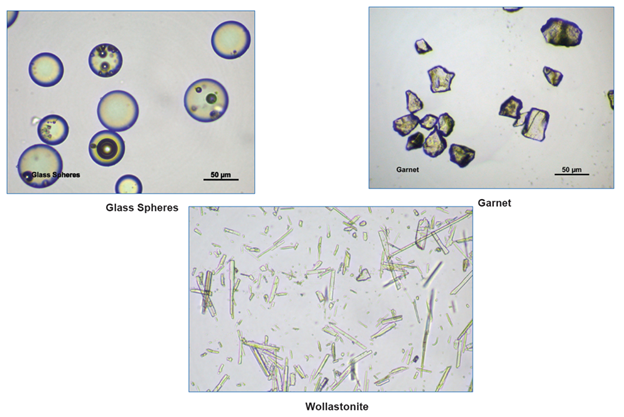
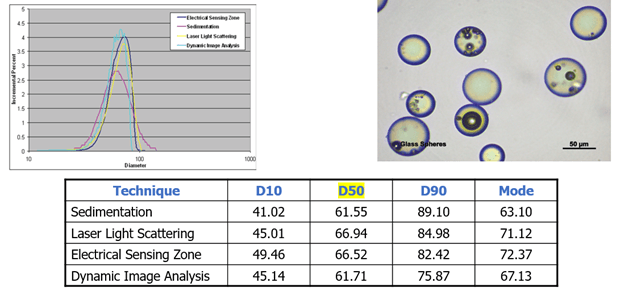
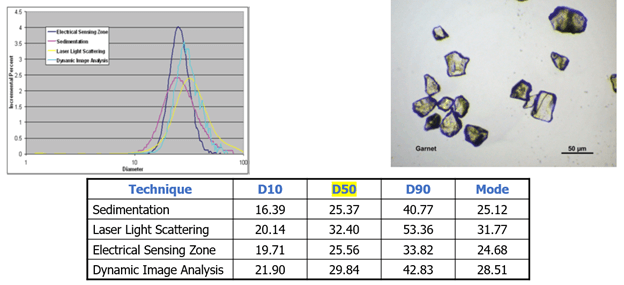
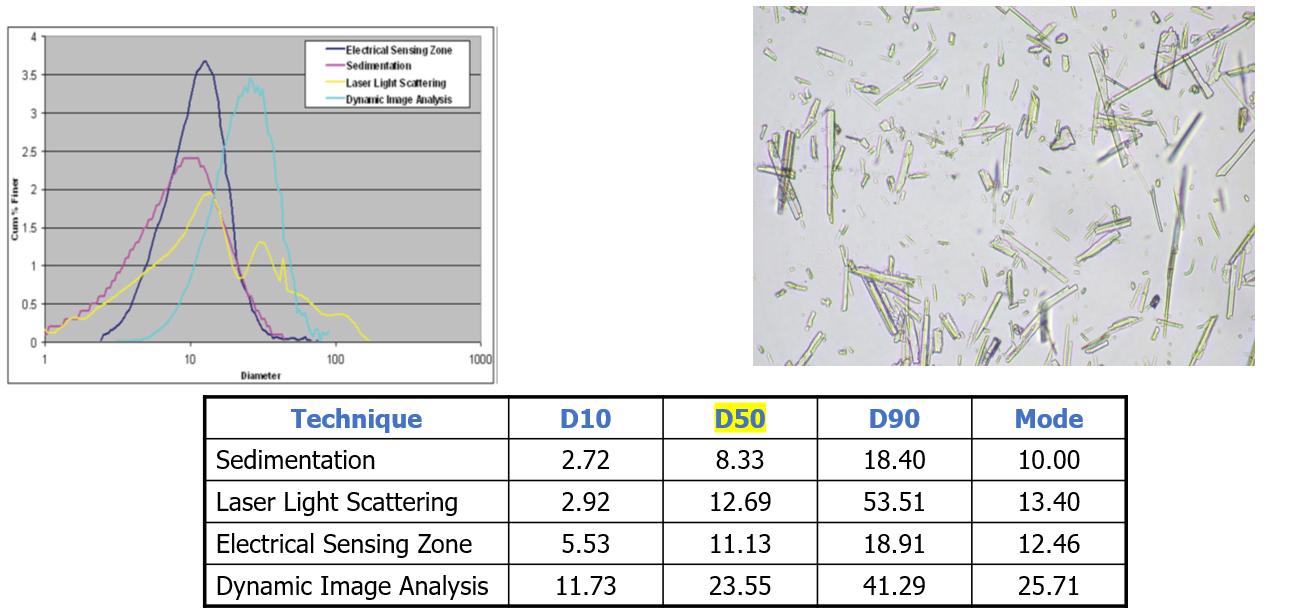
In this study, three sample types were selected based on differences in particle shape. The first sample consisted of glass beads, which are highly spherical and approximately 50 microns in size. The second sample was garnet, commonly used as an abrasive, with highly irregular particle shapes that can still yield a similar 50-micron result when measured using size-only techniques. The third sample was wollastonite, a naturally occurring mineral with many industrial applications, characterized by its elongated, needle-like particle shape.
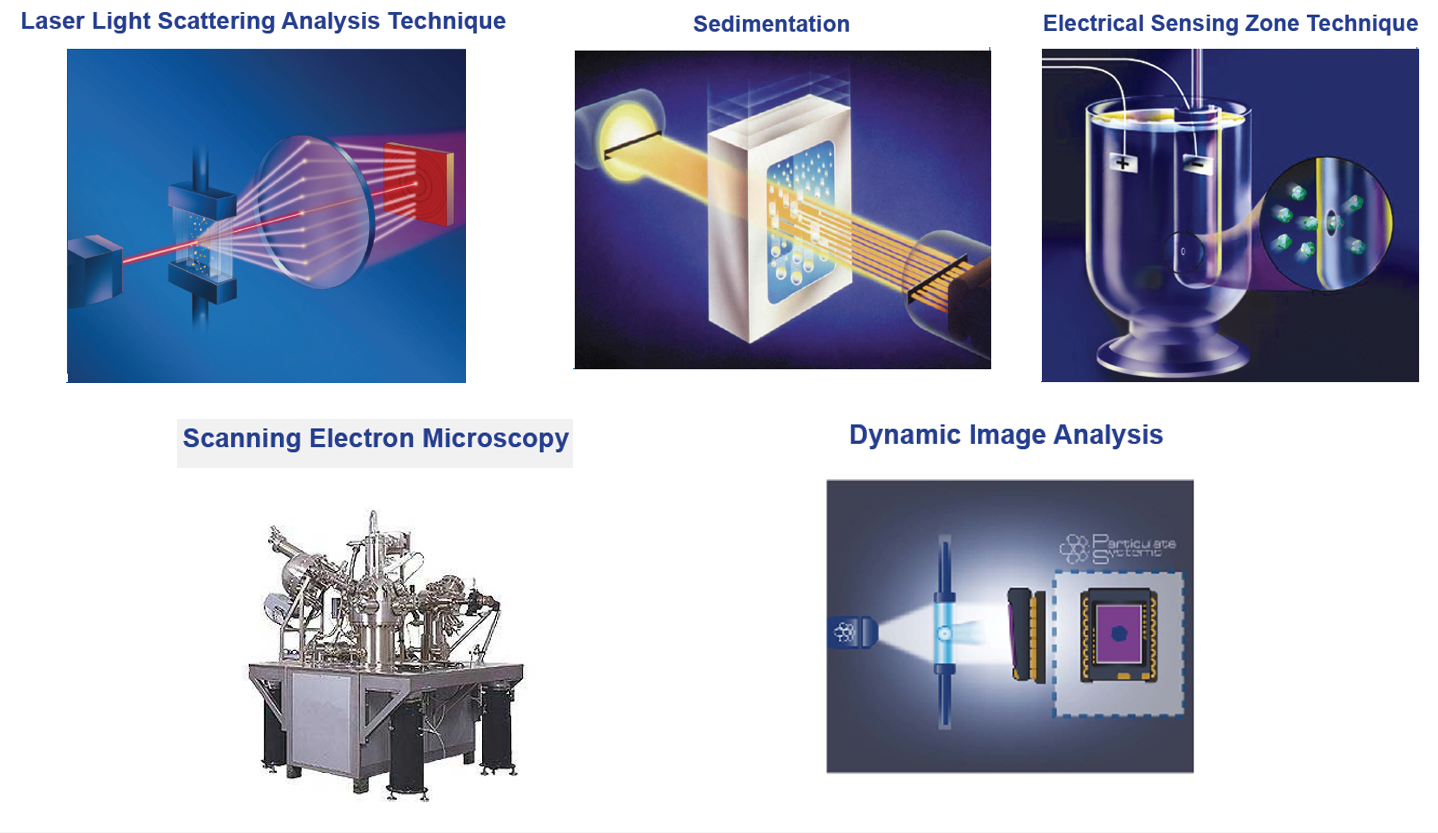
There were several techniques used to analyze these three particle types. Laser light scattering, also known as laser diffraction, is a very popular technique for particle size. Laser diffraction calculates particle size by an indirect measurement. Laser diffraction will measure the angular light intensity scattered from particles and perform a mathematical calculation to render particle size assuming all particles are around.
The second technique used was sedimentation. This technique uses Stokes’ law to measure particle velocity as it relates to particle size. Again, being an indirect measurement of particle size, data results will be displayed assuming all particles are round in shape.
The third technique used was Electrical Sensing Zone, or the Coulter Principle, where particles suspended in a conductive liquid pass through a narrow orifice where particles are counted and the voltage change as particles pass is proportional to particle volume. Once again, an indirect technique that assumes all particles are round in shape.
Lastly, dynamic image analysis was used where a direct measurement of every particle is made by taking images or photographs as they pass through a detection zone. Measurements, including size, are based on the two-dimensional projected image of every particle. This is a direct measurement technique which can give size as well as shape information.
Uses Stokes’ law to measure particle velocity as it relates to particle size. Data results are displayed assuming all particles are round in shape.
Particles suspended in a conductive liquid pass through a narrow orifice where particles are counted and voltage change is proportional to particle volume. Results are given assuming particles are all round in shape.
A direct measurement of every particle by taking images as they pass through a detection zone. Provides size as well as shape information.
For spherical particles such as glass beads, similar results are expected across different techniques, since each method reports size as an equivalent spherical diameter. As a result, the median (D50) values are consistent across all particle sizing methods. Analysis of glass spheres using four different techniques confirms this, showing close agreement in D50 values. However, some variation in the width of the particle size distribution is observed, with certain techniques producing broader distributions than others. It is important to note that all measurements here are based solely on particle size, assuming the particles are perfectly spherical.
Nearly Spherical Particles
Garnet particles are not spherical; they are typically more cube-like in shape. For such particles, the diagonal distance between opposite corners is significantly longer—approximately 30% greater—than the diameter of an equivalent-volume sphere. As a result, techniques that are sensitive to maximum particle dimension, such as light scattering and image analysis, tend to report larger particle sizes compared to methods based on equivalent spherical diameter. Analysis of garnet samples using four different particle sizing techniques shows less agreement in D50 values than observed with spherical particles. As particle shape becomes less uniform, the resulting size distributions also broaden, leading to wider statistical histograms. It is important to remember that all techniques in this comparison are reporting particle size under the assumption of spherical geometry, even when the particles themselves are not spherical.
The same shape and orientation effects observed with garnet particles become even more pronounced with rod-shaped wollastonite. Light scattering techniques tend to detect the largest particle dimension, while electrical sensing zone and sedimentation methods report a diameter based on an equivalent spherical assumption. Additionally, because light scattering systems typically have a thicker flow path than image analyzers, some elongated particles may align in ways that present a smaller dimension to the detector. Analysis of wollastonite samples using four different particle sizing techniques shows very little agreement in D50 values. This divergence highlights the limitations of size-only measurements when applied to highly anisotropic, fiber-like particles. Since all techniques assume spherical geometry, the resulting particle size distributions vary significantly, leading to substantial differences in both reported size and the overall histogram.
The examples above highlight several key reasons why particle size results can differ between techniques—and why these differences become more pronounced as particle shape deviates from spherical. In addition to these factors, a few other important considerations should be noted.
Number-based techniques, such as Dynamic Image Analysis and Electrical Sensing Zone, can report both number-weighted and volume-weighted particle size distributions. When comparing results with techniques that primarily report volume-weighted data, it is essential to use the same weighting basis. This ensures a more meaningful, “apples-to-apples” comparison between methods.
Finally, each technique measures particles using different physical principles, and these differences can directly influence the reported particle size. Understanding how each method performs its measurement is critical to interpreting results accurately and selecting the most appropriate technique for your application.
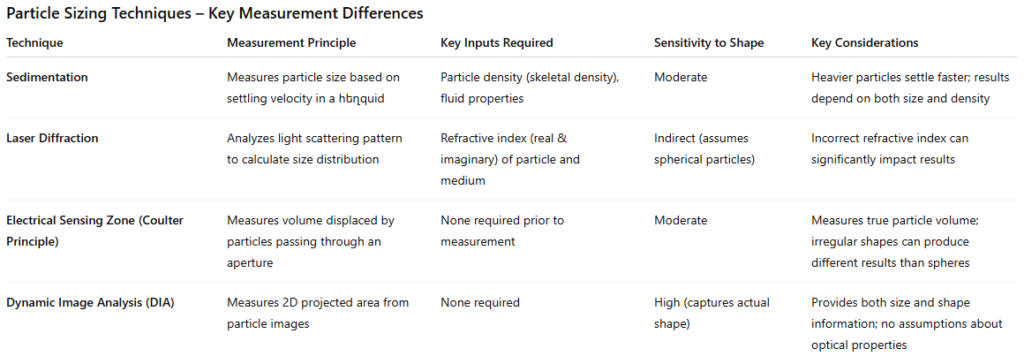
Each particle sizing technique relies on a different physical measurement principle. These differences influence how particle size is calculated and why results can vary between methods.
In sedimentation techniques, particle size is determined by the velocity at which particles settle in a liquid. This velocity depends on the drag acting on the particle’s surface, as well as material properties such as skeletal density—denser particles will settle more quickly.
For laser diffraction, accurate input of the refractive index for both the particles and the suspending medium is critical. Depending on the particle size and the optical model used, both the real and imaginary components of the refractive index may be required. Incorrect inputs can lead to significant errors in the reported particle size.
Electrical Sensing Zone (Coulter Principle) measures the volume of liquid displaced by each particle. While no prior knowledge of optical properties is required, it is important to recognize that particle shape influences the measured volume—meaning spherical and irregular particles may yield different results.
Dynamic Image Analysis determines particle size based on the two-dimensional projected cross-sectional area of each particle image. This method does not rely on optical property inputs, providing a direct measurement of particle size and shape.
In conclusion, differences in particle size results between techniques—especially for irregularly shaped particles—are to be expected and do not indicate that any method is incorrect. While perfect agreement may not be achieved, the results generally correlate well. By understanding particle shape and how each technique measures size, users can confidently interpret their data regardless of the method used.