
Particle Size and Shape are becoming more of an integral part of process control in many industries. It can be identifying agglomerate particles in metal powders for 3D printing to monitor and quantify crystal growth of active pharmaceutical ingredients. Regardless of the application, knowing this information in real-time is critical. Vision Analytical has now made this even more accessible with the newly released smartphone/tablet app that integrates with the Insight suite of products from Vision Analytical.
The Particle Insight iOS app is designed to complement the Particle Insight systems such as the Hydro Insight and Raptor Analyzers used to measure particle shape, size, and concentration, as well as the classification of particles. The app was designed as a unique tool that expands the usability of the data given by the Insight systems. By using the app on their iPhone or iPad, users are now able to view and study data of their raw materials from anywhere in the world the instant that a result is completed on their Particle Insight or Hydro Insight instrument.
The iOS app works in corroboration with Dropbox. This is a well-established and independent secure cloud-based repository of data. Using Dropbox allows individuals and companies to rely on a proven, secure, and independent company to store the encrypted datafiles for the Insight required for the iOS app.
To load the app on your iOS device, take a photo of this QR Code (we currently only offer this app for iOS devices)……….

To view this app on the Apple iOS store.
How to setup the device to link to the Insight system?
For detailed instructions on how to interface your Hydro Insight or Particle Insight to your newly downloaded app, click here. iPad – Particle Shape
The app comes with four demo samples already saved. You can begin working with them immediately; see “Using the iOS app” below.
Assuming you followed the instructions above, your Insight system can automatically or manually upload data to the Hydro/Particle Insight Raptor application. Samples will be uploaded automatically at end of run time, if “Upload to Dropbox” is checked in the Completion Actions settings. Alternatively, you can upload a sample at any time using File > Upload to Dropbox.
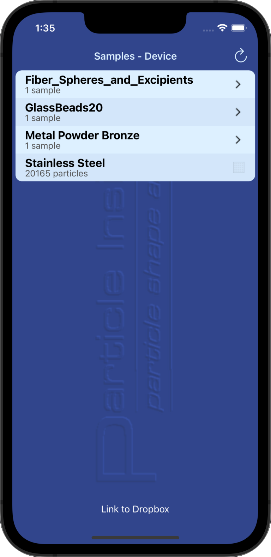
On your iOS device, select “PI cloud” at the bottom of the sample list panel. All samples that have been uploaded to the Dropbox account will be listed and are available for downloading to the device.
Tap on a run series name to see the individual sample names in that series. Tap on a sample name, then select “Download”. The run results display will open for review. The run data is not yet saved to the device. To save the run, select “Save” at upper right of the screen.
Select “Device” at the bottom of the sample list to list all samples that have been saved to the device. Tap a sample name to review the data. In Device mode, select “PI Cloud” to switch to the Cloud data.
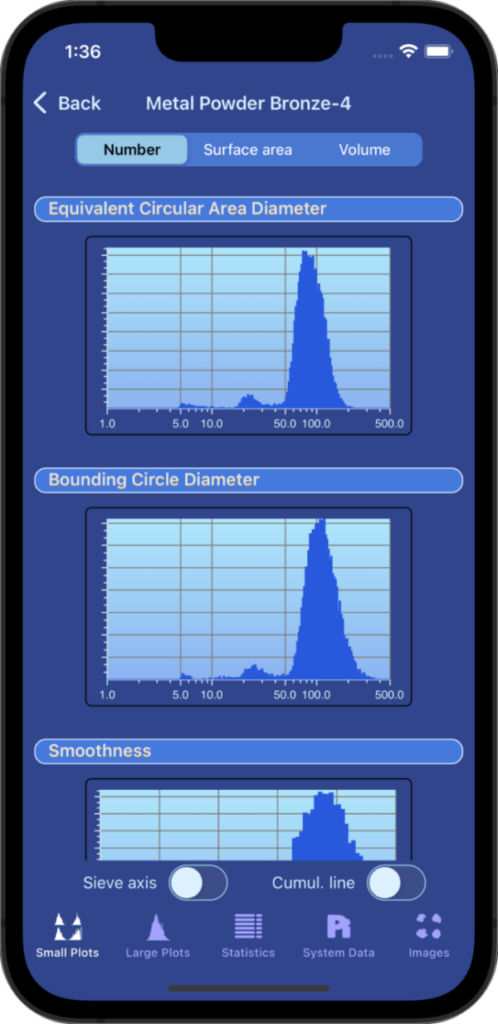
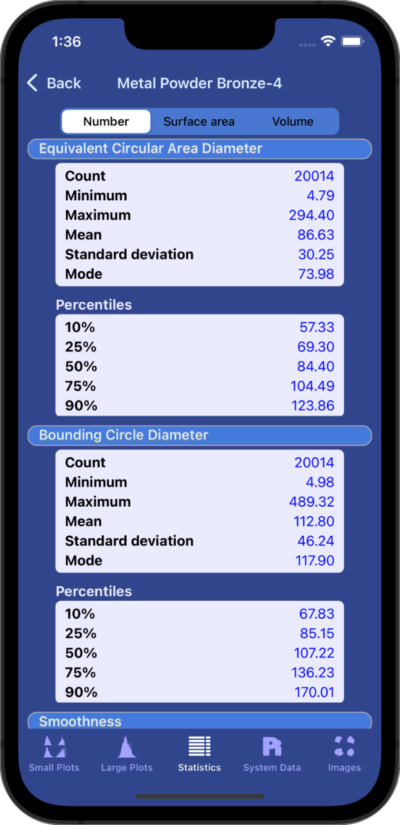
Statistics and histogram data that was generated by the Hydro/Particle Insight instrument can all be viewed and analyzed interactively. You may select between Small Plots mode and Large Plots mode, in which the whole screen is used for a single graph, or you may select the Statistics listing.
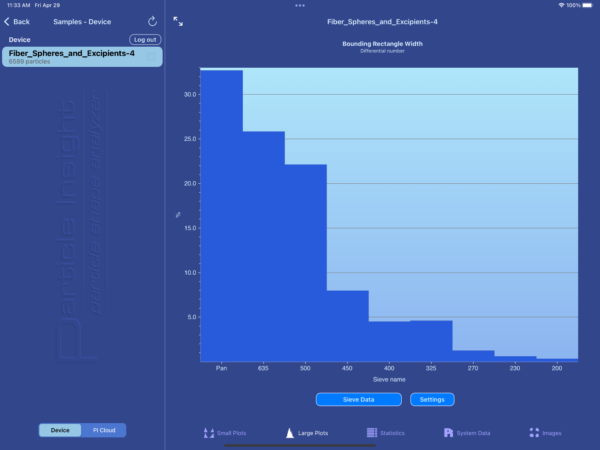
In the Settings section, the user can select any of the up to 32+ size and shape measures that the Hydro/Particle Insight analyzed for any particular sample. The user can also select the statistical weighting of the histogram: number, volume or surface area. The Cumulative line can be turned on or off, and if sieve-equivalent data is available, the user may view a simulated sieve-based histogram of their sample. Tap on the histogram to view the data with all the changes made in Settings. Shown here is the data from a sample run in the form of a Sieve Equivalent report, on a tablet device.
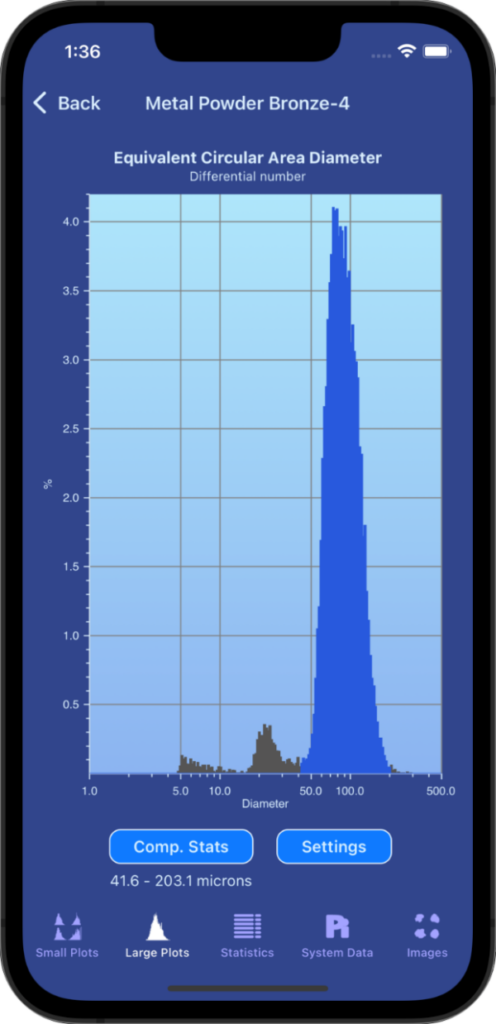
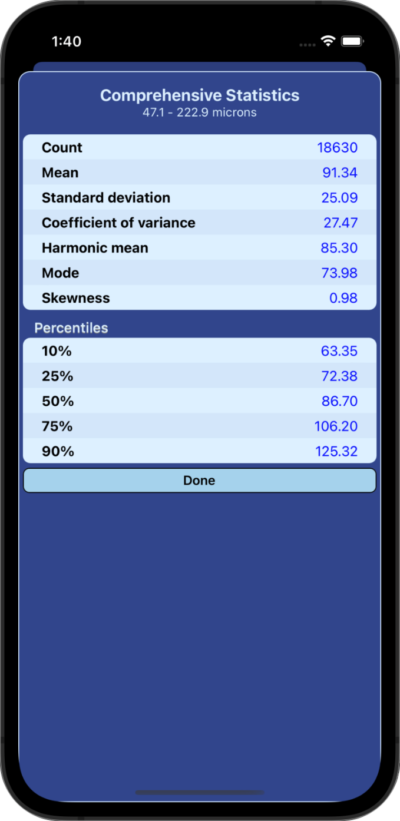
To review a more complete set of statistical data for any histogram, press the “Comprehensive Statistics” button in the Large Plot tab. One unique feature of the app is the ability to analyze subsections of the statistical histogram. For example, with your finger, select a subrange of the histogram you are viewing and automatically the Comprehensive Statistics and the cumulative line will reflect only the section you are selecting.
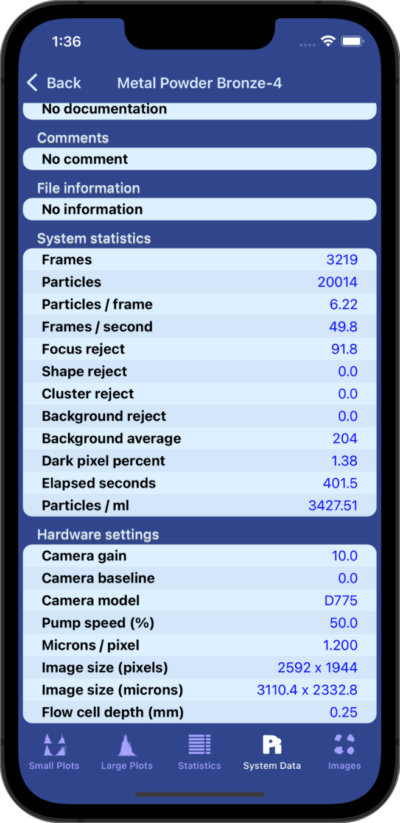
The System Data page shows all the sample documentation, User Comments, File information, System statistics, and Hardware settings saved during the analysis of the sample. Data saved also includes all data stored by the 21CFR Part 11 electronic signatures feature of the Particle Insight if it was turned on during the analysis. Scroll to view all the system data that was in effect for the selected run.
Dropbox has its own policy for collecting user account data and handling user files. The Dropbox privacy policy can be found at https://www.dropbox.com/privacy. Their privacy policy FAQ can be found at The Dropbox Privacy Policy: frequently asked questions.