
Background Information
Investigators use particle characterization methods to better understand key properties that can impact an end product or the manufacturing process. As development progresses, particle characterization methods are typically transferred to the manufacturing process, where the control of various parameters is measured to ensure the manufacturability and efficacy of the final product.
For many years, particle size has been a vital characterization method. Most of the established techniques for particle size characterization are indirect measurement techniques that render particle size information assuming all the measured particles are round. Most particles in industry are not round, leaving significant doubt about the ability of size-only techniques to offer enough characterization information.
Irregular particle shape can significantly impact how particles interact with each other, how they flow, and how they compact, ultimately affecting the efficacy of products. Because of this, many years ago scientists embraced and elevated the characterization of particles based on shape and size by using direct measurement techniques such as microscopes. Although slow and tedious, microscopy allows users to obtain qualitative information about their raw material particles.

Image analysis as it applies to particle shape was first explored in 1963, when the “Krumbein Scale” was presented for geologists who wanted a standardized way to measure particle roundness and sphericity. This scale was visual — using sample images on a sheet of paper to compare particles — and was subjective. Even so, it tells us that for many decades the need to understand particle shape has been just about as critical as particle size. As time went on, scientists were able to use microscopes to view small sample populations and better understand the shape of their particles.
It wasn’t until the early 1990s, when improved machine vision cameras and higher-performing computers became available, that the shape of particles could be analyzed in a more standardized way with a much higher sampling of particles. Image analysis — whether the particles are static or dynamically moving — involves very fast image processing.
How does dynamic image analysis work? The basics
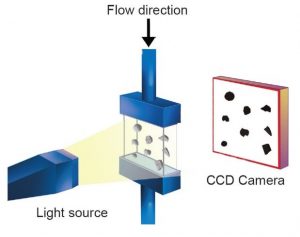
Because this is a high-speed technique designed to measure tens of thousands of particles in minutes or seconds, particles are suspended in fluid to ensure they are dispersed and homogeneous. The suspended particles flow through a flow cell. An illumination source on one side of the flow cell shines light through the cell to a lens and digital camera on the other side. The camera records dark silhouettes of the particles and sends the images to a computer in grayscale format.
The Principle of Operation
- Sample introduction — Wet or dry particles are introduced into the measurement system in a controlled, steady flow.
- Illumination — A bright, high-intensity light source (LED or halogen) provides optimal contrast for edge detection.
- Image capture — A high-speed camera captures sharp, blur-free images of each particle in motion.
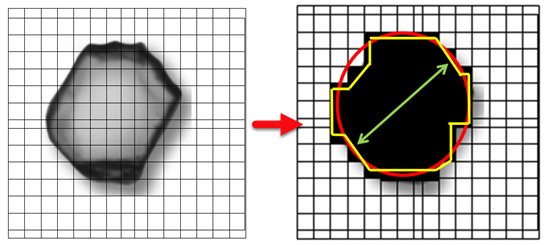
- Automated analysis — Advanced software measures each particle’s size and shape while also storing its image for later review. The software converts each image to a binary format, applies various rejection and thresholding parameters, and uses the resulting binary pixelized image to calculate the 30+ shape parameters for each particle. At the same time, each particle is saved as a thumbnail, objective evidence of every measured particle.
More detail
Because dynamic image analysis uses camera technology to capture images, it helps to understand a few fundamentals of image taking. The first is field of view.
Field of view (FOV) is the area (x, y) of the imaging zone where particles are measured. FOV size depends on lens magnification: the higher the magnification, the smaller the field of view. This is the equivalent of zooming in with a camera to photograph something very small. By zooming in — increasing magnification — small particles look bigger on the screen. Adequate magnification matters because the larger the particles appear in the field of view, the more pixels are applied to the particle edges. Since shape is determined using the pixels obscured by particles, more pixels means greater resolution and accuracy of the results. The opposite is also true: as you decrease magnification, or zoom out, the field of view increases and captures more area.
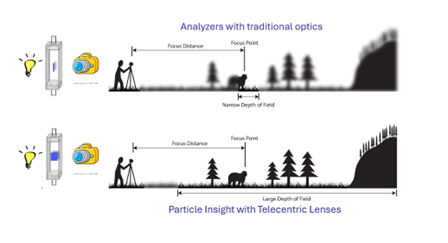
Depth of field is also important to understand. As in basic photography, depth of field is the range — closest to and furthest from the camera — within which all objects (particles, in our case) are in focus. Dynamic image analysis always rejects particles that are out of focus.
Depth of field is controlled by the lens aperture diameter, typically specified as the f-stop number. Reducing the aperture diameter (increasing the f-stop) increases depth of field, because only light rays traveling at shallower angles pass through the aperture to reach the image plane. For dynamic image analysis, the key point is that the equipment manufacturer will always try to ensure the greatest possible depth of field.
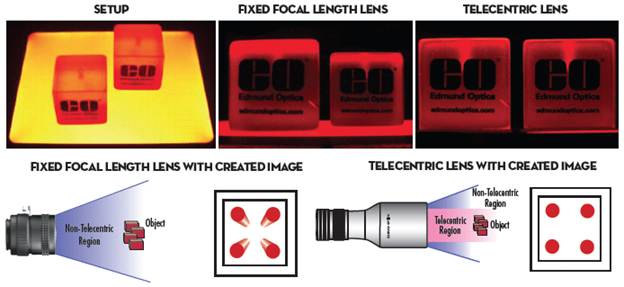
One last optical issue to understand is perspective error and how to correct for it. Perspective error occurs when a broad depth of field allows particles farther from the imaging source to “look” smaller simply because of their distance. As shown below (image courtesy of Edmund Optics), one object looks smaller because it is farther away — yet both are within the depth of field and in focus. To address this, many dynamic image analysis instruments incorporate telecentric optics that correct for the error. Without this correction, particles that are within the field of view and depth of field but farther from the imaging source can be reported as smaller than identical particles closer to it, producing erroneous data.
What do we get?
Now that you know how it works, what does it mean — and what does it give you as an end user?
Remember that the most popular method for particle characterization is particle size, and the most common size techniques report results as if every particle were round. Because dynamic image analysis is a number-based technique, it can give far more information — starting with both a volume-weighted and a number-weighted particle size distribution.
Number and volume weighting
As a counting-based measurement, dynamic imaging reports statistical size data as both number-weighted and volume-weighted distributions. Number-weighted distributions are important for visualizing the fine particles present in a sample. Volume-weighted distributions are important for revealing small amounts of large particles, such as agglomerates. Both are always calculated and reported. Results can also be shown as a sieve correlation, which lets you compare current sieving results to automated dynamic imaging and makes method transfer easier.
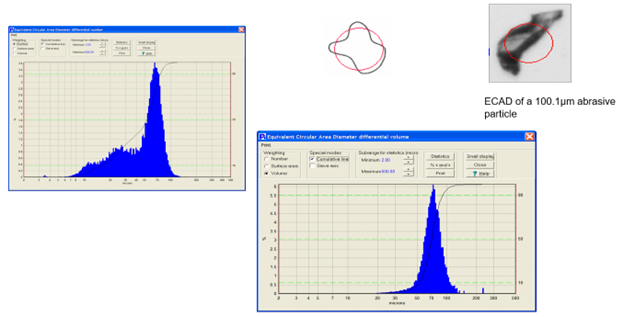
Above, we show both the number-weighted and volume-weighted particle size distribution results of an abrasive particle. The shape model used here is a size model that estimates particles as if they were round — the model customers typically use to compare dynamic image analysis results to size-only techniques. As you can see, the two histograms are very different. The number-weighted histogram shows all the fine particles in the sample, which can be critical depending on the application: in filtration, for example, a high number of fine particles can plug a filter quickly and needs close monitoring. The volume-weighted histogram is equally important when the presence of large particles or agglomerates is a concern.
Counting and concentration
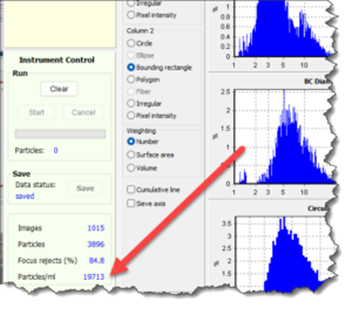
Because dynamic image analysis measures each individual particle, it also reports particle counting and concentration. Concentration is displayed in real time as particles per milliliter. Total count is given once analysis is complete, and the count can cover all particles or a single class or type. This is critical when working with samples that have rare events, or when you need to know the concentration of any population or sub-population. Counting instruments — such as Coulter counters and dynamic imaging instruments — also incorporate dilution factors that account for any pre-dilution of the sample.
Viewing questionable statistics
One very important feature of dynamic image analysis is the ability to view the particles that make up a questionable statistical result. Size-only instruments can render histograms containing questionable data with no way to verify what that data is. Dynamic imaging lets the user view the actual particles behind any region of a size or shape distribution — objective evidence available only with dynamic image analysis.
Comparisons
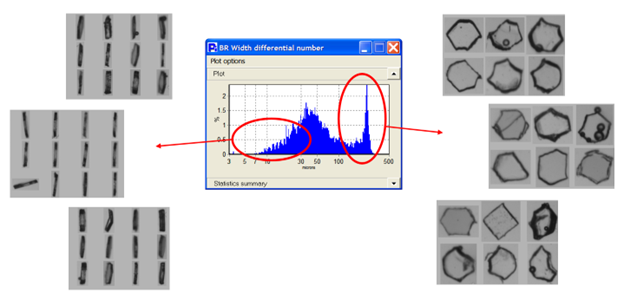
Dynamic imaging lets you compare different sample lots or analysis runs not only by size but also by shape. Two samples may show no difference in size yet have considerable differences in shape.
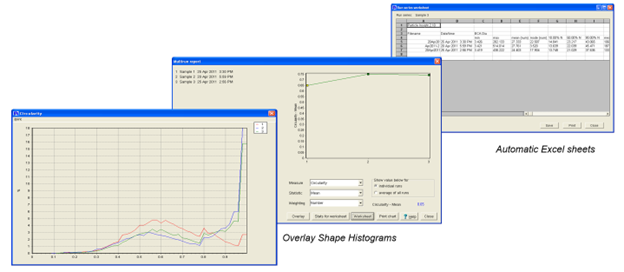
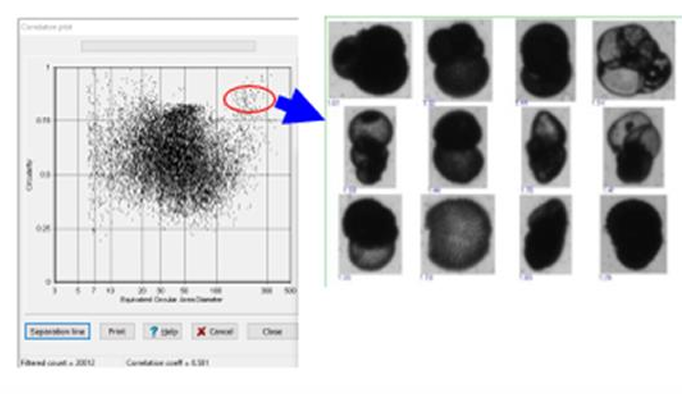
Correlation plots
Correlation plots give you a view of all analyzed particles with the goal of finding rare events. Identifying a single particle, or a set of particles, within an analysis of tens of thousands would be nearly impossible without this function. Correlation plots can be created from any two available shape measures.
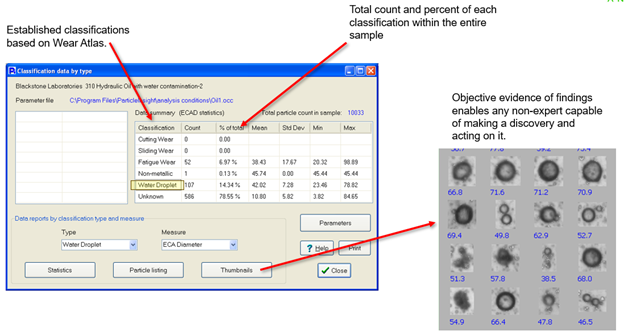
Particle classification
Having 32+ shape measurements for every particle makes it far easier for the software to differentiate one particle from another. When running a multi-component sample, those measurements enable particle classification — a feature that separates and quantifies the subpopulations of particles within a sample.
Dry and wet flow capability a key advantage
While many systems are limited to liquid-based flow imaging, Vision Analytical’s technology also supports dry particle flow analysis. This expands the range of applications to include powders, granules, and airborne particles, letting you characterize materials that competitors cannot measure in-flow.
This article is also published on AZoNetwork; read it here.
Keep reading: See how dynamic image analysis compares to Micro-Flow Imaging, explore the Raptor 1788, or browse our products, which include dry powder modules for both at-lab and portable systems, and the Knowledge Center.
Why Flow Imaging Microscopy is powerful
Flow Imaging Microscopy combines the statistical robustness of automated image capture with the morphological detail only imaging can provide. That makes it invaluable when:
- Visual verification is essential to confirm particle identity or source.
- Size and shape both influence product performance or quality.
- High throughput is required to analyze thousands of particles quickly.
- Dry particle analysis offers unique insight into materials best analyzed in dry suspension.
Applications across industries
Flow Imaging Microscopy (Dynamic Image Analysis) is widely used in:
- Biopharmaceuticals — detecting protein aggregates and particulate matter in injectables.
- Environmental science — monitoring microplastics and suspended solids in water.
- Lubricants and fuels — characterizing wear debris and contamination.
- Powder materials — measuring dry powders in manufacturing and research.
- Food & beverage — ensuring quality in suspensions and emulsions.
Frequently asked questions
What is Flow Imaging Microscopy? Flow Imaging Microscopy, also known as Dynamic Image Analysis, is a method for capturing high-resolution images of particles in motion — either in a liquid flow cell or a dry suspension system. It enables precise measurement of size, shape, and concentration, along with a visual record for every particle.
Can Flow Imaging Microscopy measure dry particles? Yes. While many systems are limited to liquid samples, Vision Analytical’s technology also supports dry particle flow analysis, enabling accurate characterization of powders and granules — a capability many competing systems do not offer.
Why choose Flow Imaging Microscopy over other particle analysis methods? Unlike techniques that provide only a size distribution, Flow Imaging Microscopy delivers both dimensional and morphological data, plus image thumbnails for visual verification. That makes it ideal for contamination analysis, quality control, and advanced research.
At a glance: Flow Imaging Microscopy with Vision Analytical
- Wet & dry capability — analyze both liquid suspensions and free-flowing dry particles.
- High-speed imaging — thousands of particles measured in minutes.
- Detailed morphology — size, shape, and a visual image for every particle.
- Broad applications — from pharmaceuticals to environmental monitoring.
- Proven technology — trusted by labs and manufacturers worldwide.