
Fluid Cleanliness & Contamination Monitoring
ISO 4406, ISO 21018 & ISO 4407
A Practical Guide for Fuel & Lubrication
What reliability engineers, oil-analysis labs, and fuel-quality teams need to know about cleanliness coding, particle-count monitoring, instrument calibration, and where image-based analysis adds value beyond a single number.
In brief
ISO 4406 is the cleanliness code everyone reports (the familiar 19/17/14). ISO 11171 defines how automatic particle counters are calibrated. The second edition of ISO 21018-1 (2024) is the pivotal change: it formally recognizes monitoring techniques beyond light obscuration — and names image analysis in its own summary of methods as the technique that delivers particle shape, not just size and count. Counting tells you how dirty the oil is; imaging tells you what the dirt is — and that distinction is now written into the standard.
Why Fluid Cleanliness Drives Reliability
In hydraulic, fuel, and lubrication systems, the fluid is both a power-transmitting medium and a lubricant. Solid particles in that fluid interfere with lubrication and abrade the very clearances they pass through. Contamination is consistently cited as the leading root cause of premature component failure — worn pumps, sticking valves, scored actuators, and plugged injectors all trace back to particles that were too small to see and too numerous to ignore.
The particles that matter most are not the big, obvious ones. The 4–14 µm range sits right at the clearance dimensions of servo valves, pump pistons, and high-pressure fuel injectors, which is exactly why the cleanliness standards anchor on those sizes. A fluid that looks clear to the eye can still carry thousands of these particles per milliliter.
New oil is not automatically clean oil. Fluid straight from a drum or tote is frequently dirtier than a sensitive hydraulic or fuel system can tolerate, and routinely needs filtration before it ever enters service. Treating "new" as a synonym for "clean" is one of the most common and expensive assumptions in contamination control.
How the Standards Fit Together
Fluid-cleanliness standards are often lumped together, but each one answers a different question. Knowing which standard does what keeps a program from confusing a code, a calibration, a monitoring method, and an analytical method.
| Standard | What it governs | Role |
|---|---|---|
| ISO 4406 | Coding the level of contamination by solid particles (the 3-number code at ≥4, ≥6, ≥14 µm) | Reporting / classification |
| ISO 4407 | Particle counting on a membrane by optical microscope — manual or image-analysis software | Analytical method (imaging) |
| ASTM D7596 | Automatic particle counting and particle shape classification of oils using a direct imaging integrated tester | Analytical method (imaging + wear classes) |
| ASTM D7647 | Automatic particle counting by light extinction, using dilution to eliminate false counts from water and soft particles | Analytical method (APC) |
| ISO 11171 | Calibration of automatic particle counters (APCs) for liquids, traceable to NIST SRM 2806 | Calibration |
| ISO 21018-1:2024 | General principles for monitoring contamination; recognizes techniques beyond light obscuration and names image analysis among them | Monitoring (overview) |
| ISO 21018-3 | Monitoring by the filter-blockage (pore-blockage) technique | Monitoring (method) |
| ISO 21018-4 | Monitoring by the light-extinction (light-obscuration) technique | Monitoring (method) |
| ISO 16232 | Cleanliness of components of fluid circuits (road vehicles), including microscopic / image analysis | Component cleanliness |
ISO 4406 is the language; everything else is how you generate the numbers you report in that language. A defensible program is explicit about which counting method produced a given code and how that instrument was calibrated or verified — because the same fluid can read differently across methods.
ISO 4406: Reading the Cleanliness Code
ISO 4406 condenses a full particle-size distribution into a compact three-number code such as 19/17/14. Each number is a scale code that corresponds to the number of particles per millilitre at or above a given size:
- First number — particles ≥ 4 µm(c) per mL (the largest count, since it includes everything bigger)
- Second number — particles ≥ 6 µm(c) per mL
- Third number — particles ≥ 14 µm(c) per mL
The scale is logarithmic: each one-point increase in a code number represents a doubling of the particle-count range. So a fluid at 19/17/14 is carrying roughly twice the ≥4 µm contamination of one at 18/17/14 — a detail that makes small code changes more significant than they look.
How a code number maps to a particle count
Each code number defines a band of "particles per mL, of that size and larger." A few representative bands:
| ISO 4406 code | Particles per mL (more than) | up to and including |
|---|---|---|
| 14 | 80 | 160 |
| 16 | 320 | 640 |
| 17 | 640 | 1,300 |
| 18 | 1,300 | 2,500 |
| 19 | 2,500 | 5,000 |
| 20 | 5,000 | 10,000 |
| 22 | 20,000 | 40,000 |
The "(c)" notation — as in 4 µm(c) — signals that particle sizes are defined per the current ISO 11171 calibration (covered next). Older data calibrated to the superseded ISO 4402 method uses different sizes and is not directly comparable, which is a frequent source of confusion when reviewing historical trends.
ISO 11171: Calibrating the Counter
An ISO 4406 code is only as trustworthy as the instrument that produced it. ISO 11171 is the standard that defines how automatic particle counters (APCs) used for hydraulic fluids, fuels, and lubricants are calibrated and characterized — so that a 19/17/14 from one lab means the same thing as a 19/17/14 from another.
Calibration is traceable to NIST Standard Reference Material 2806, a certified suspension of ISO Medium Test Dust in hydraulic fluid. ISO 11171 also sets minimum APC performance requirements — sample-volume reproducibility, flow-rate stability, sensor resolution, coincidence-error limits, and counting accuracy — and the size designation µm(c) comes directly from this calibration basis.
When NIST released a new batch of SRM 2806 (the "b" lot), it yielded particle sizes roughly 10% larger than earlier batches, which made fluids "appear" dirtier and filters "appear" less efficient — even though nothing physical had changed. Later revisions (ISO 11171:2020, certified against a consensus SRM 2806d) cut the inter-laboratory uncertainty substantially. The lesson for reliability teams: when comparing trends across years, confirm the calibration basis before concluding that a system got dirtier.
Crucially, ISO 11171 calibration assumes a counting principle — light extinction or light scattering — that infers size from how much light a particle blocks or redirects. That assumption is also the source of the method's blind spots, which we return to in Section 07.
ISO 21018: Monitoring Contamination
ISO 21018 is a multi-part family focused on monitoring the level of particulate contamination — tracking cleanliness over time and during flushing. The pivotal development for fuel and lube is the second edition of Part 1, released 22 October 2024, which does three things that matter for modern programs: it recognizes valuable techniques besides light obscuration (APC), it provides procedures and definitions for using contamination monitors outside the laboratory, and it acknowledges that those instruments are calibrated differently than an APC.
The key distinction: APC vs. PCM
ISO 21018-1:2024 draws a clear line between two classes of instrument, and understanding it explains exactly where an image-analysis system fits:
- Automatic Particle Counter (APC). Senses individual particles using optical light extinction or light scattering, sizes and counts them, and must be calibrated to ISO 11171 for hydraulic fluids, fuels, and lubricants.
- Particle Contamination Monitor (PCM). Automatically measures particle concentrations at certain sizes but cannot be calibrated to ISO 11171, with output as a size distribution or a contamination code. This is the category that opened the door to newer technologies.
The standard also explains why this category was needed: laboratory APC testing requires special environments and specialist labs, which delays results; instruments are increasingly operated in or near the workplace, on-line or in-line, where direct traceability to national measurement standards may not be possible. The document was written to provide uniform procedures for exactly those monitors.
Image analysis is named in the standard
Annex A of ISO 21018-1:2024 includes a summary of technique attributes (Table A.7) that lists the monitoring methods available to the industry side by side. Image analysis appears as a named technique — and it is the only method in the table whose distinguishing output is shape (microscope counting reports "type," SEM reports "type and shape"). The selected rows below follow the standard's own values:
| Technique | On-line | Off-line | Suction | Size (µm) | Output | Precision |
|---|---|---|---|---|---|---|
| Automatic counting (APC) | Yes | Yes | Yes | 1.0 – 3000+ | Size, Number, ISO codes | Quantitative |
| Image analysis | Yes | Yes | Yes | 2.0 – 3000+ | Size, Number, ISO codes, Shape | Quantitative |
| Microscope counting | No | Yes | No | 2.0 – 3000+ | Size, Number, ISO codes, Type | Quantitative |
| Filter blockage | Yes | Yes | Yes | 6 – 14 | Size, ISO codes | Qualitative |
| SEM | No | Yes | No | 0.01 – 3000+ | Size, Number, ISO codes, type & shape | Quantitative |
This isn't an inference. The foreword to the 2024 edition lists, among its changes from the 2008 first edition, that the clause describing image analysis "has been updated to accurately describe the capabilities of image analysis." In other words, ISO/TC 131 deliberately revised the standard to reflect what image-based systems can now do — recognizing it as a quantitative monitoring technique that reports ISO codes and shape, usable in or near the workplace where a full ISO 11171 laboratory calibration isn't practical. That is precisely the niche a portable dynamic-image-analysis system fills.
ISO 4407 & ASTM D7596: The Imaging Methods
Alongside ISO 21018-1, two method standards give image analysis its technical home. ISO 4407 is the fluid-power standard for determining contamination by counting particles captured on a membrane filter using an optical microscope, and it explicitly provides for image analysis as well as manual counting, using either transmitted or incident light, down to 2 µm. It defines an "image analyser" as instrumentation that automatically sizes and counts particles — recreating a digital image of each particle from its grey-scale contrast against the background — and recommends ungridded membranes for that automated route, reducing the operator dependence that limits manual microscopy.
ASTM D7596 — "Automatic Particle Counting and Particle Shape Classification of Oils Using a Direct Imaging Integrated Tester" — is the standard that specifically describes the direct-imaging, shape-classifying instruments used in oil analysis. It underpins the cutting / sliding / fatigue / non-metallic / fiber / water / air wear classes, working in concert with the Noria Wear Atlas.
For automotive and component-cleanliness work, ISO 16232 plays the analogous role — extracting contaminants from components onto a membrane and sizing/counting them, including by microscopic and image analysis. Together, ISO 4407 and ISO 16232 establish that imaging is an accepted, standardized way to characterize fluid and component cleanliness — not a fringe technique.
Automatic particle counting gives you a number fast. Microscopy and image analysis give you the same counts plus a picture of each particle — its size, its shape, and visual evidence of what it actually is. The standards landscape now supports both, which lets a program use fast counting for routine trending and image analysis where identity and morphology drive the decision.
Where Light Obscuration Falls Short
Light obscuration (LO) and light extinction are fast, reproducible, and the workhorse of fluid cleanliness counting. But they infer particle size from a drop in light intensity at a single sensor, which builds in some structural blind spots. A light-blockage system effectively measures a chord length and reports a size that assumes the particle is a sphere — so an elongated sliver and a round grain that block the same amount of light report as the same size. In fuel and lube specifically, the practical problems are:
- Shape is assumed away. Because the result is a sphere-equivalent size, a fatigue chip, a cutting-wear sliver, a fiber, and a silica grain of similar light-blocking area are indistinguishable — yet they tell very different stories about machine health.
- Translucency skews the size. Particles whose optical properties differ from the calibration dust can be sized incorrectly, since the method reads light reduction rather than a true edge.
- Edge effects cause false large counts. Particles passing near the cell edges move more slowly through the sensing zone and can be falsely reported as larger than they are.
- Air bubbles and water are counted as particles. Entrained air — often unavoidable after the agitation needed to keep particles in suspension, and stubborn in viscous oils — and emulsified water both block light like solids, inflating the code even though they call for completely different corrective actions.
This isn't a vendor talking point — it's written into the light-extinction standards. ASTM D7647, the test method for automatic particle counting of lubricating and hydraulic fluids, exists specifically because water and soft particles produce false counts: it prescribes a dilution and "water-masking" procedure to remove their contribution. Its own text states that water droplets and free water are counted as particles, that air bubbles give false positive readings, that semi-insoluble additives and defoamant by-products ("soft particles") cause falsely high counts, and that odd-shaped particles and fibers can be sized incorrectly depending on their orientation through the sensing zone. A method that needs an elaborate workaround to subtract water and soft particles is, by its own admission, unable to tell them apart from real contamination on its own.
An inflated code from air or water can trigger an unnecessary fluid change, a filter "failure" investigation, or a false alarm in a condition-monitoring program. Conversely, treating a rising count as generic "dirt" can mask an early wear problem that a shape-aware method would have flagged. The count alone can't separate these cases.
What Dynamic Image Analysis Adds
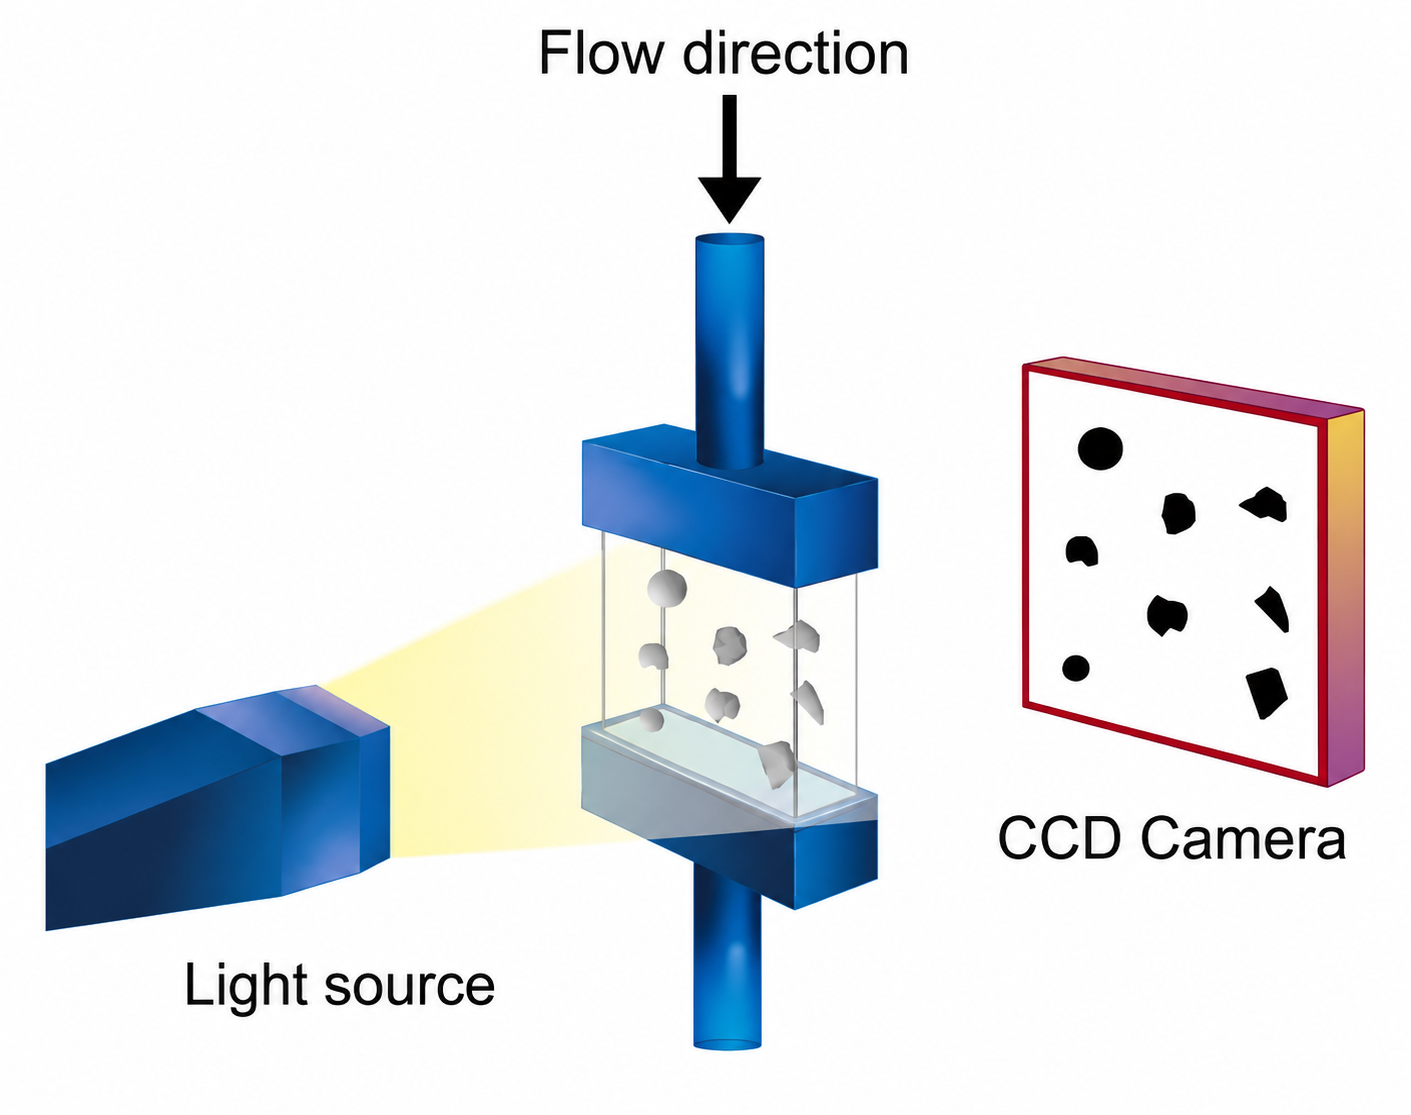
Dynamic image analysis (DIA) uses a high-speed camera and light source to capture an image of each particle as it flows past in the fluid. Each image is converted to binary, and real-time particle data — including dozens of shape measures per particle, plus a saved thumbnail — is calculated from the pixel area each particle displaces. Because every particle is individually imaged, the method can do things a single-sensor counter cannot:
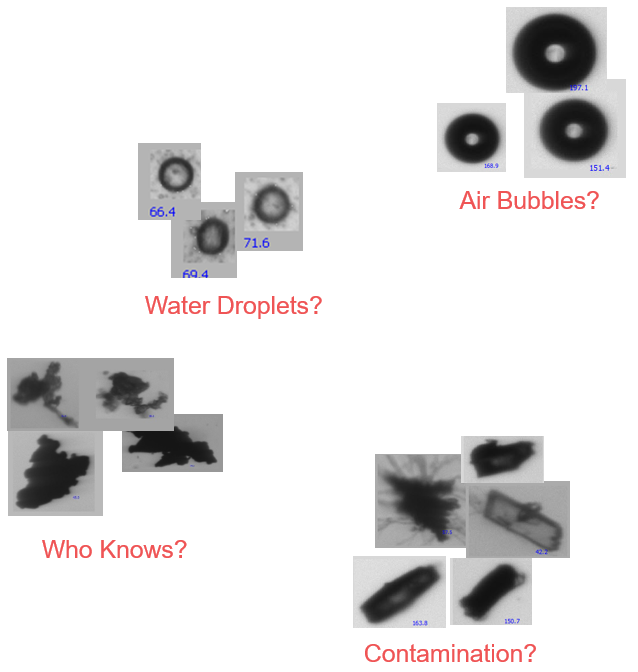
- Separate air bubbles, water droplets, and solids. In oil, air bubbles and water droplets are both round but differ in brightness and refractive behavior — air bubbles appear dark, water droplets lighter — so the software can identify and filter them (commonly by a circularity filter) instead of letting them inflate the count.
- Classify by wear mode. Particles can be sorted into the recognized wear classes — cutting, sliding, fatigue, non-metallic, fibers — following the ASTM D7596 framework and the Noria Wear Atlas, with custom classes definable for a specific application.
- Provide visual evidence. A stored thumbnail of every particle is objective evidence for an investigation, an audit, or a warranty discussion — "seeing is believing," with no outside expert required to interpret a number.
- Report shape and concentration down to ~1 µm. Fine resolution lets a team spot outliers in a population and report concentration for the whole sample or for individual sub-populations (e.g., just the fatigue-wear particles).
A DIA-based monitor is, in ISO 21018-1 terms, a particle contamination monitor — it is not claimed to carry the same national-calibration traceability as an ISO 11171-calibrated APC, and credible programs say so plainly. What the 2024 standard establishes is that such a monitor is a recognized, quantitative technique that reports ISO codes and shape, with results that can be compared against APC. The argument is "image analysis adds information," not "image analysis replaces APC calibration."
What this looks like in a deployed system
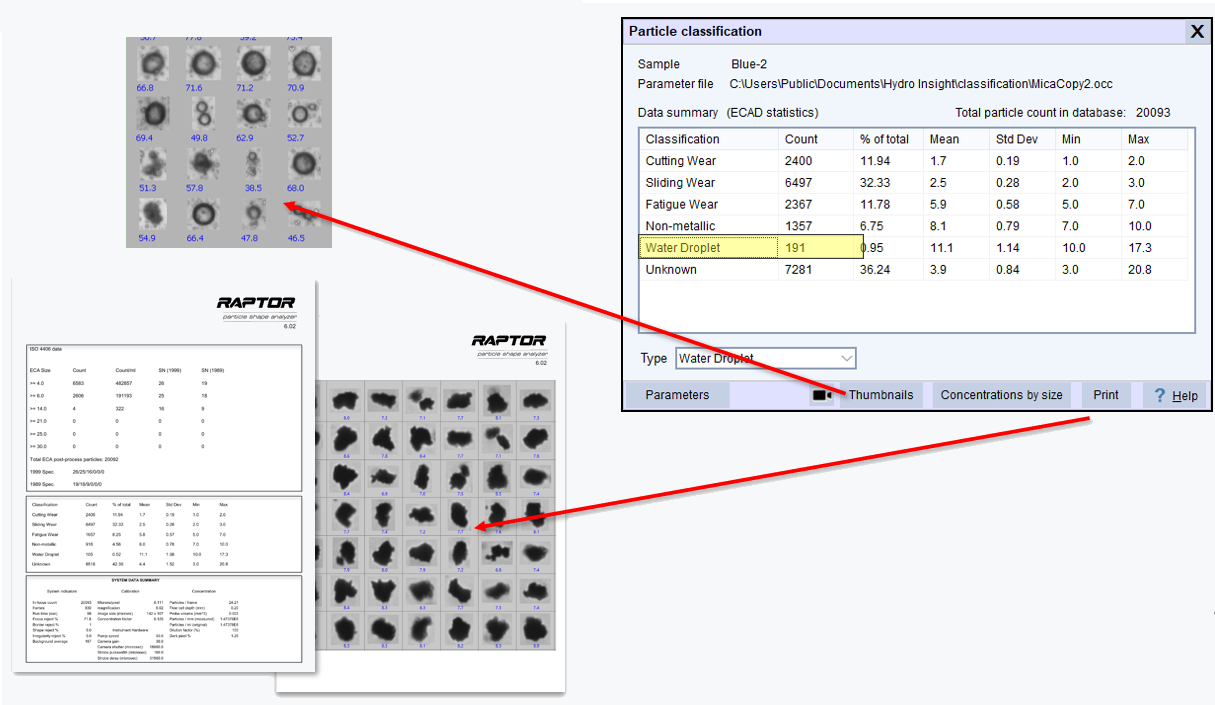
Vision Analytical's Raptor / Particle Insight platform is one example of a dynamic-image-analysis monitor built for fuel and lube work. In practice that means: detection and shape classification from 1 µm to ~100–300 µm; reporting in ISO 4406, NAS 1638, and NAVAIR codes; wear classification to ASTM D7596 and the Noria Wear Atlas; air-bubble and water-droplet discrimination; concentration for the whole sample or any sub-population; portable and benchtop use, on-line or off-line via disposable flow cells; and immediate field pass/fail so decisions don't wait on a lab.
This isn't an argument to abandon automatic counting. Fast LO/APC counting is ideal for routine cleanliness trending against ISO 4406 targets. Image analysis earns its place where the question shifts from "how many?" to "what are they, and why are they here?" — field decisions, wear diagnosis, false-count elimination, and root-cause work. A strong program uses both, with the imaging method aligned to ISO 4407 and recognized as a monitoring approach under ISO 21018-1.
Building a Monitoring Workflow
A practical fuel and lubrication cleanliness program layers fast routine counting with deeper characterization where it pays off. A workable framework:
- Set targets by component sensitivity Define ISO 4406 target codes from the most sensitive component on the system (servo valves and injectors are the usual drivers). Targets are the backbone of the whole program.
- Sample correctly, every time Flush sampling valves, draw from active return lines rather than cold reservoirs, and control agitation so you don't introduce air. Sampling error swamps instrument error — get this right first.
- Trend with automatic counting Use LO/APC (ISO 11171-calibrated, or an ISO 21018-4 monitor) for routine, high-frequency cleanliness trending against your targets.
- Characterize with image analysis When a count rises, when air or water is suspected, or when wear is the concern, bring in DIA / ISO 4407 image analysis to identify what the particles actually are.
- Build a particle reference library Store classified images of known particle types (fibers, spheres, fatigue chips, water, air) so future investigations resolve faster.
- Document method and calibration basis Record which method produced each result and how the instrument was calibrated or verified, so trends remain comparable over time and defensible in an audit.
Setting Target Cleanliness Levels
There is no single "clean" code — the right target depends on the most sensitive component, the operating pressure, and the consequences of failure. The general principle is that tighter clearances and higher pressures demand lower codes. Representative starting points (always confirm against OEM requirements):
| Application | Typical ISO 4406 target (illustrative) |
|---|---|
| Servo valves / high-sensitivity hydraulics | 16/14/11 or cleaner |
| Proportional valves / high-pressure systems | 17/15/12 |
| General industrial hydraulics | 18/16/13 |
| Gearboxes / lower-sensitivity lube systems | 19/17/14 or higher tolerance |
The ISO 4406 code is an excellent tool for setting targets and tracking a KPI over time. But over-relying on a single code can hide what's driving a change. Pairing count trends with periodic morphological analysis turns "the code went up" into "the code went up because we're seeing more fibers," which is the difference between an alarm and a diagnosis.
Frequently Asked Questions
What is the difference between ISO 4406 and ISO 4407?
Does ISO 21018 replace ISO 11171?
Why do air bubbles and water inflate my particle count?
Can image analysis report an ISO 4406 code?
Why did my historical cleanliness data shift even though nothing changed?
Is automatic particle counting good enough on its own for fuel and lube?
What sizes does ISO 4406 actually report, and why those?
Questions about fuel & lubrication particle monitoring?
Our team works with reliability, oil-analysis, and fuel-quality groups on cleanliness coding, contamination monitoring, and bringing image-based characterization into the workflow.