APPLICATION NOTE: AN-004
How Particle Shape Analysis Impacts Manufacturing Process and Final Product
How Particle Shape Analysis Impacts Manufacturing Process and Final Product.
Particle analysis plays a key role in the pharmaceutical industry in both product efficacy and manufacturing. Particle size can impact the dissolution rate of an excipient or active pharmaceutical ingredient (API) and can impact formulation or tableting of a drug. Various established techniques serve the particle sizing needs of the pharmaceutical market today. However, in some situations, simply monitoring particle size is not enough to control a product’s outcome. Particle shape may be even more important to monitor and control. In recent years, the desire for particle shape information has led to the consideration of image analysis for research and quality control in the pharmaceutical sector.
Determining Particle Shape
Most methods for particle size analysis assume particles are all spheres and report result as “equivalent spherical diameter.” This assumption is not acceptable in some applications. For example, monitoring particle size alone will not determine if a sample will travel and flow properly in production. Some particles may be spherical, and some may be rectangular; the spheres would flow much easier than the rectangular-shaped particles and with much less energy. Rectangular-shaped particles present more of a challenge to ensure proper and homogeneous flow. Particle shape significantly affects flowability and the particle’s ability to mix properly with other sample components, affecting the outcome of the finished product.
A more realistic example is demonstrated in Figure 1.
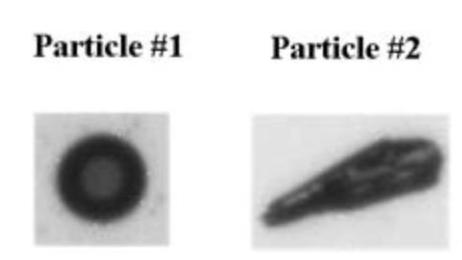
Figure 1
Both particles have an equivalent spherical diameter of approximately 63 μm. However, both are clearly different in shape and most likely behave differently.
Most methods used to determine particle size would render the size of these particles as equivalent spheres. The particles have an “equivalent spherical diameter” of approximately 63 μm, which is calculated by approximating a sphere with the same amount of area as the particle silhouette.
Although the reported particle size results would render similar statistical histograms, these particles would not behave similarly. In a production environment, shape irregularity would affect flowability, sharp edges would affect the ability to adhere to other particles, and the amount of exposed surface would affect the amount of coating required. If these or other shape-related reasons are important to a process, then using a size-only analyzer may not capture necessary parameters.
Image Analysis System
The image analysis system Pi Sentinel PRO allows users to selectively view the shape of the particles from different areas of a histogram based on shape parameters.

Figure 2
Additional Capability of Pi Sentinel PRO
Besides the ability to measure particle size and shape, the Pi Sentinel PRO also measure concentration. This system analyzes particles when captured, so by nature, they can count the particles to supply a particle concentration. In addition, if a sample contains populations of diversely shaped particles, this image analysis system can quantify the populations in an analyzed sample based on software-calculated shape parameters.
The histogram sample in figure 2 shows two distinct sample peaks. The Pi Sentinel PRO enables the user to selectively view the actual particles that created each histogram peak.
Of course, seeing the particle images is always beneficial. In addition to performing statistical particle analysis, this image analysis system captures an image of every analyzed particle. Many times, users rely on statistical histograms as “fingerprints” of the sample size and are unable to determine the types of particles making up certain portions of a distribution. Users can set statistical boundaries to view representative particles, all particles, or only particles that may impact select portions of a histogram.
For example, a user could view only the spherical particles in a sample population by specifying a range for the Circularity. Considering a perfect sphere to have a circularity of 1, the user would select the circularity range to be close to 1 in order to view all spherical particles.
In a more practical example, using multiple shape parameters in an image analysis system directly measures particle surface roughness or smoothness and allows users to monitor correlations of shapes. For example, a process could mandate that as particle size increases, the particle becomes smoother. Only the Pi Sentinel PRO enables the automation of such a correlation measurement and incorporates a statistical value to the correlation.
The case study below shows some benefits of automated image analysis using a dynamic image analyzer with actual pharmaceutical excipients. As this case study shows, users can better control and monitor particles using shape parameters, resulting in a more effective outcome and cost-effective control method.
Case Study: Surface Roughness Comparisons In Eight Excipients
In the pharmaceutical industry, excipients are selected based on the ability to take on various roles. Besides being inactive carriers of the API, they play a significant role in manufacturing. Some excipients are selected based on their abilities as binders, fillers, and vehicles to manage the API dissolution rate. However, their importance in coatings to protect deterioration and in lubricants to ensure flowability is also important.
In all these cases, the excipient surface roughness must be monitored. Shape characteristics, specifically perimeter irregularity expressed by the Smoothness value, determine surface roughness. Particle shape analysis monitors and controls how these particles will interact with the API during packaging and tableting and monitors and controls their absorption through the digestive tract. The instrument used in this case study, Pi Sentinel PRO, analyzed particles suspended either in aqueous or organic solvents. In this case study, 9 of the 28 size and shape parameters available with the Pi Sentinel PRO were selected for the eight excipients. Only one parameter, Smoothness, will be discussed in this case study. The Smoothness parameter is calculated from the area and perimeter of the particle projection. The parameter is a number between 0 and 1, and a perfectly smooth circle has a Smoothness equal to 1.
Like circularity, Smoothness is affected by the degree to which the general particle shape is not round. However, Smoothness is also affected by perimeter irregularity, which is an indication of surface roughness.
As an example, refer to Figure 3 for differences in Smoothness for various test shapes.
As shown, the particle surface roughness alters the Smoothness. Note that Smoothness is affected by surface roughness, not by size or circularity.
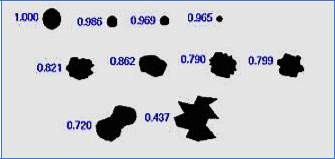
Figure 3
Analysis Results
This case study was based on an analysis of up to 10,000 particles from times of 60 seconds to four minutes, depending on the sample dispersion used for each sample. Figure 4 shows the recovered Smoothness (measure of surface roughness) for each of the eight analyzed excipients. The table was sorted in decreasing order. Note that the closer the Smoothness is to 1, the smoother the surface.
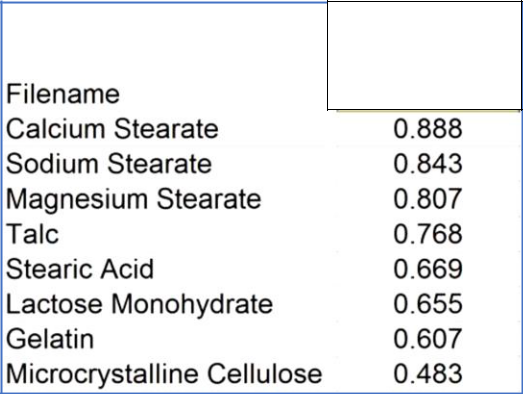
Figure 4
Figures 5, 6, and 7 show sample pictures that the Pi Sentinel PRO took automatically for some of the excipients. The photos reveal that sodium stearate with a mean Smoothness of 0.843 has a smoother surface than lactose monohydrate with a mean Smoothness of 0.655. As a practical example, the sodium stearate would flow easier in a manufacturing tableting process than the lactose monohydrate.
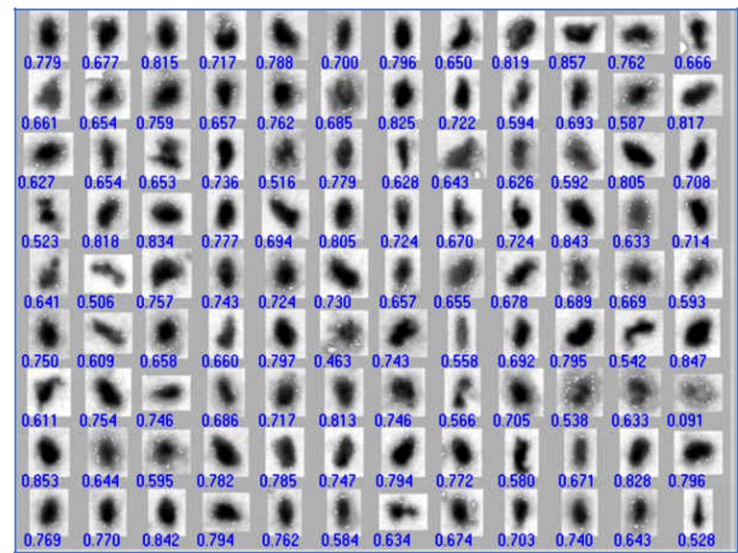
Figure 5: Sodium stearate
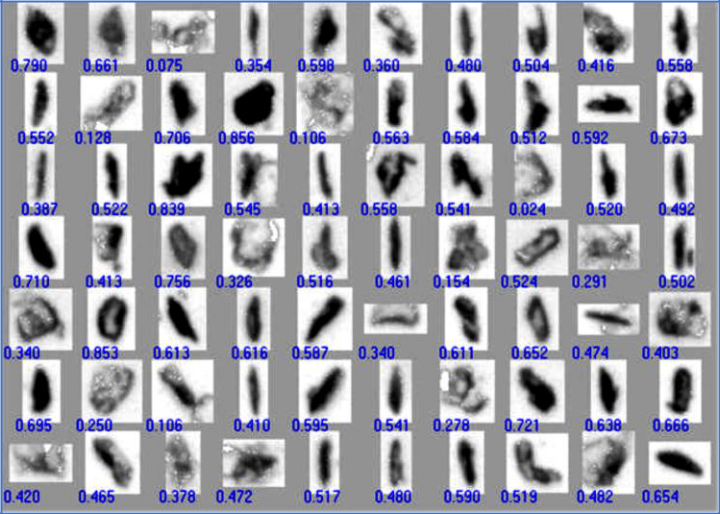
Figure 6: Stearic acid
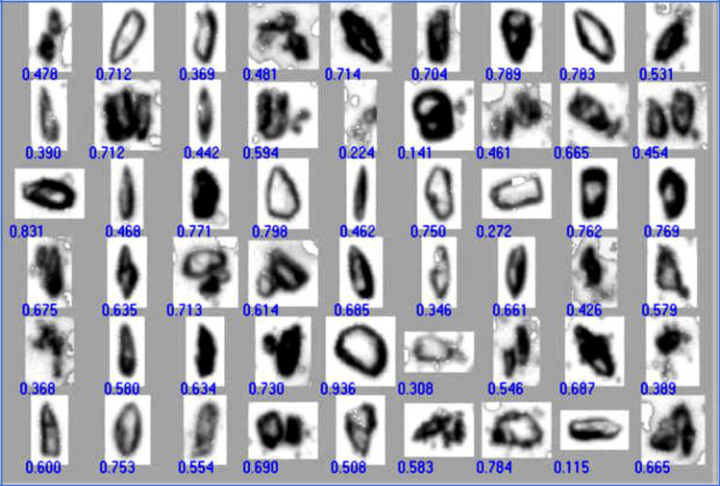
Figure 7: Lactose monohydrate
Conclusion
Measurement of particle shape for select excipients is important for manufacturing and delivery. As glidants and lubricants, an excipient with low surface roughness or high Smoothness would promote powder flow and aid in tablet formation. In delivery, excipient fillers with a rough surface can affect binding and dissolution and can affect where the API is released in the digestive tract. The advent of dynamic image analysis automates delivery of information in a way not previously available.
In this case study, the Pi Sentinel PRO differentiated excipient specimens based on surface roughness, a particle feature important for manufacturing and product efficacy.
Reference
- Tinke, A.P., Govoreanu, R., Vanhoutte, K. “Particle Size and Shape Characterization of Nano and Submicron Liquid
Dispersions,” American Pharmaceutical Review, Sept/Oct 2006

