Particle Shape Analysis of Ocean floor sediments for Marine Research
Marine scientists extensively study ocean floor sediments, which consist of fine particles such as sand, clay, volcanic ash, minerals, and organic materials. Analyzing these sediments is crucial for understanding sediment transport, environmental changes, and geological processes. However, the small grain size of these particles presents significant challenges in analysis.
Importance of Particle Shape in Marine Sediment Analysis
The shape and size of sediment particles are key parameters utilized for characterizing sediment transport and weathering processes, which are governed by environmental conditions such as climate. Assessing particle shape often involves either qualitative descriptors or time-consuming measurements of shape parameters by a human operator. Accurate particle shape analysis is essential for predicting the behavior of sediments under various marine conditions.
Advanced Imaging Techniques for Particle Shape Analysis
Traditional particle size analysis methods often assume spherical particles, leading to inaccuracies. Advanced imaging techniques, such as Dynamic Image Analysis, provide a more comprehensive understanding by capturing detailed images of particles in motion. This method allows for the analysis of tens of thousands of particles in seconds, ensuring a representative measurement of the sample.
Case Study: Analyzing Ocean Floor Sediments
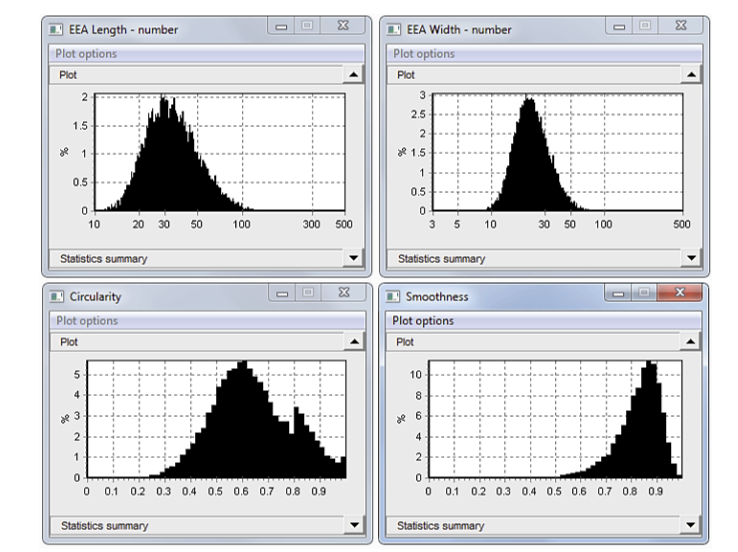
In a recent study, two distinct types of ocean floor sediments were examined using advanced imaging techniques. The first sample contained particles ranging from 10 to 200 microns in length, with circularity centered around 0.6, indicating non-spherical shapes. Frequency distributions for measures such as Equivalent Circular Area (ECA) diameter revealed a bimodal distribution, suggesting the presence of two particle sub-classes.
By focusing on parameters like “Smoothness,” researchers could categorize particles into “smooth” and “rough” groups. Setting a Smoothness threshold allowed for effective separation of these subgroups, providing insights into the sample’s composition. Scatter plots further illustrated the relationship between particle smoothness and size, often revealing an inverse correlation—smaller particles tended to be smoother.
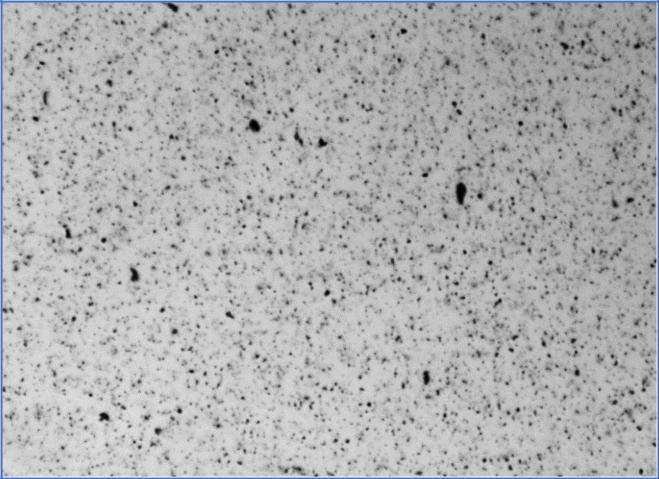
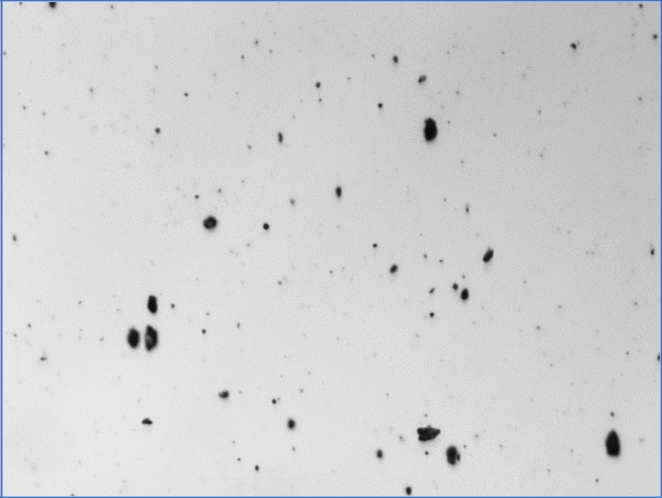
The first sample obtained with the Particle Insight system comprises extremely small particles, measuring less than 50 microns, and is more similar to a silt than to sand grains. A representative image describes a large proportion of tiny particles. A sample of thumbnails is represented here.
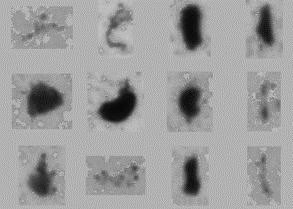
Due to this particularly high particle concentration, clusters of particles are often characterized as a singular unit. Such clusters are represented by the faint thumbnails here. These can be overcome by re-analyzing the sample.
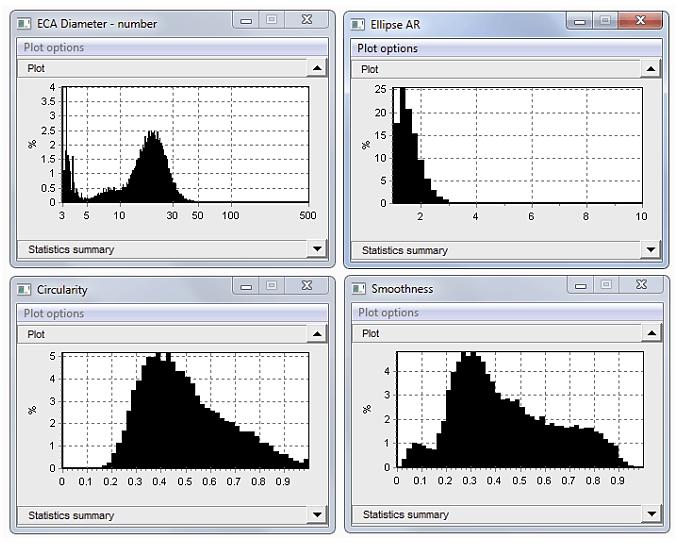
The Circle shape model is optimum for such small sizes. Only three measurements are required for this first sample, comprising ECA diameter, Circularity and Smoothness. This information is integrated with Ellipse AR (Ellipse Aspect Ratio) to determine whether there are any non-spherical objects present. The unfiltered sample results describe an irregular diffusion of sizes less than 50 microns:
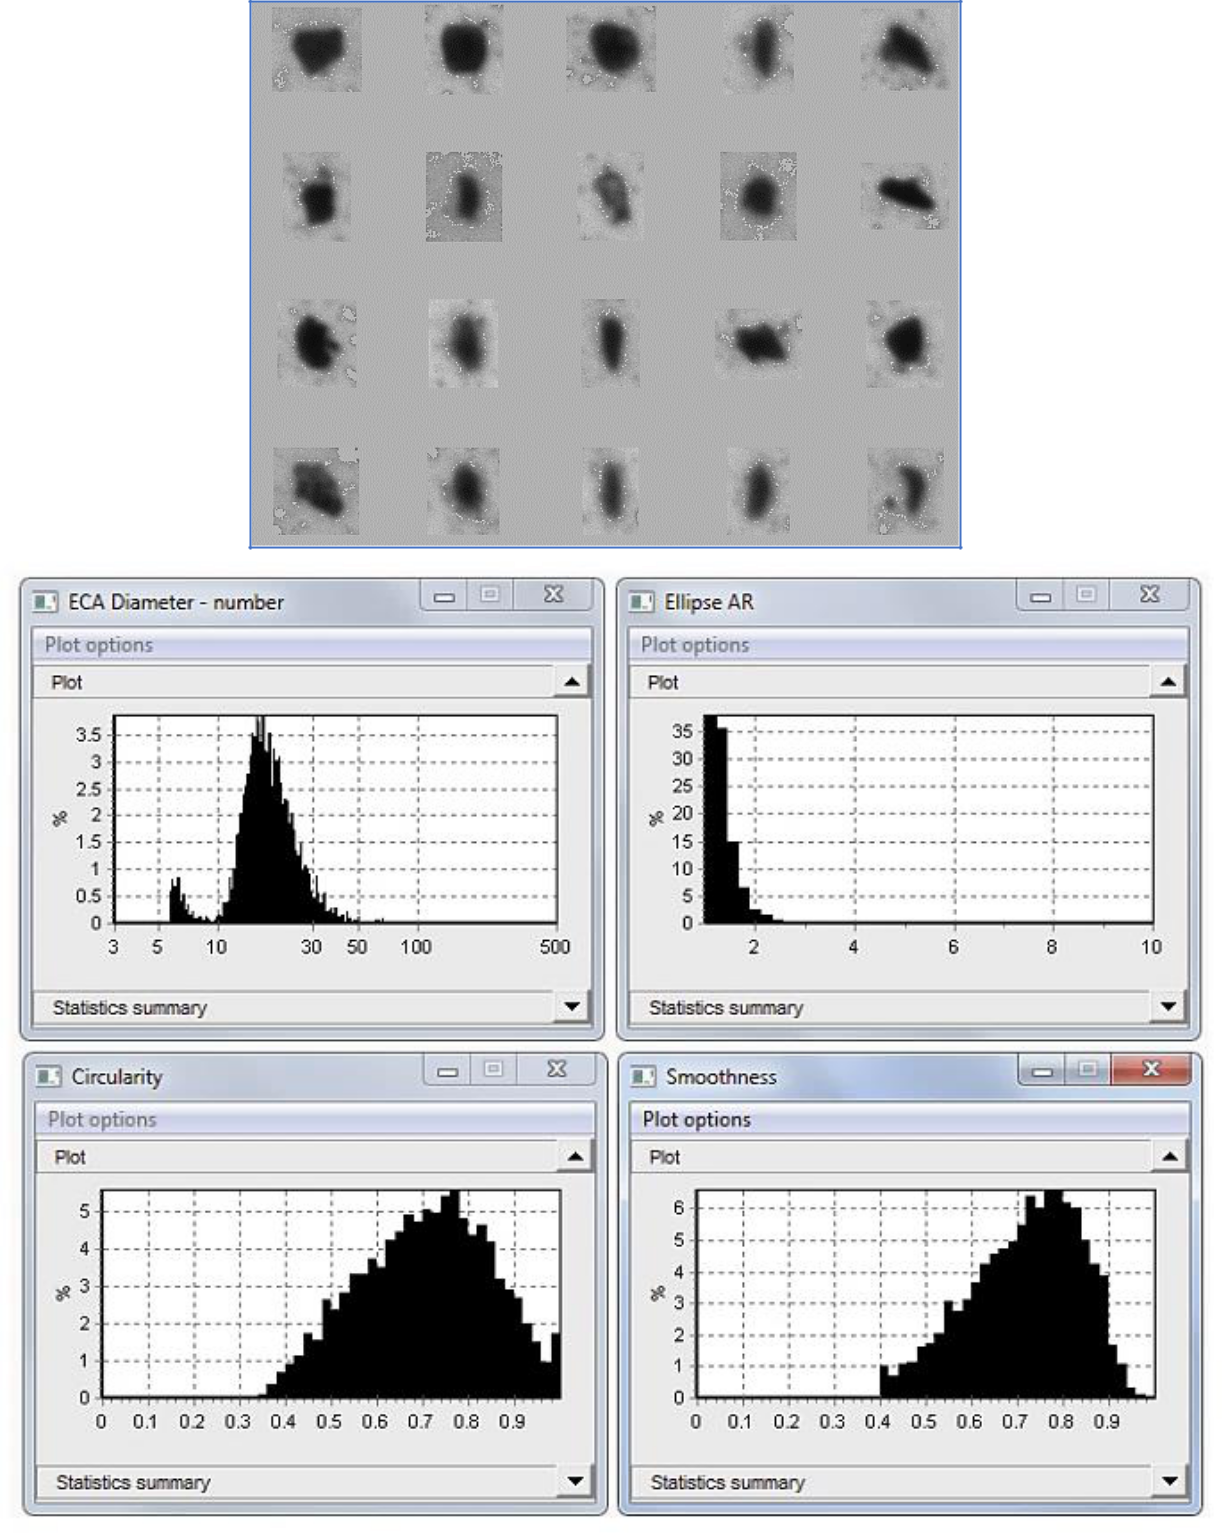
To overcome the clusters, the sample should be re-analyzed according to certain conditions, encompassing Circularity above 0.35, Smoothness above 0.4, and rectangularity above 0.65. Following the imposition of these conditions, a sample of thumbnails describes the following appearance. The filtered reanalysis yields a size distribution that predominantly ranges from 10 to 50 microns. Circularity and Smoothness are now substantially higher.
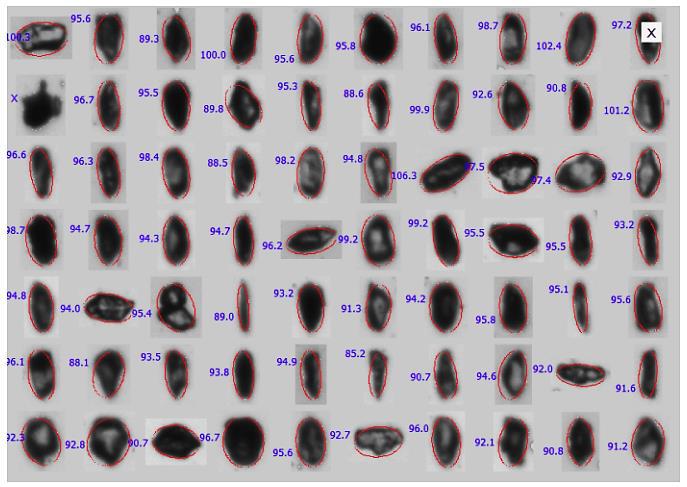
The second sample embodies somewhat larger and more defined particles. A representative image is presented here. The particle thumbnails describe crystalline grains embodying an aspect ratio of around 2:1. Fixing ellipses to these grains yields an adequate measurement of Length and Width (numbers given are EEA length).
Filtering is not required for this sample. The size and shape examination outcomes are presented below. Particle lengths range from 10 to 200 microns. Average circularity is about 0.6, which represents the non-spherical shapes.
Conclusion
Accurate particle shape analysis of ocean floor sediments is vital for marine research, offering insights into sediment transport, environmental changes, and geological processes. Employing advanced imaging techniques, such as Dynamic Image Analysis, enables precise classification and quantification of particle subgroups. This detailed understanding aids in predicting and enhancing the behavior of marine sediments under various conditions.

