Differentiating Pollen Types Using Dynamic Image Analysis
Different Pollen have Different Shape
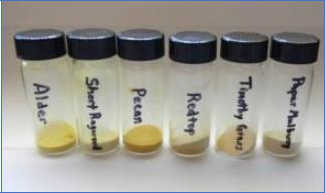
Dynamic Image Analysis (DIA) offers a powerful method for analyzing and differentiating pollen samples based on both particle size and shape. While traditional size-only methods assume all particles are spherical, they often fail to distinguish between pollen species or detect fragments and debris. In this study, six types of pollen—Alder, Short Ragweed, Pecan, Redtop, Timothy Grass, and Paper Mulberry—were evaluated using DIA to highlight morphological differences.
Looking to apply shape-based particle analysis in your lab? Request an instrument quote.
Why Shape Matters in Pollen Morphology
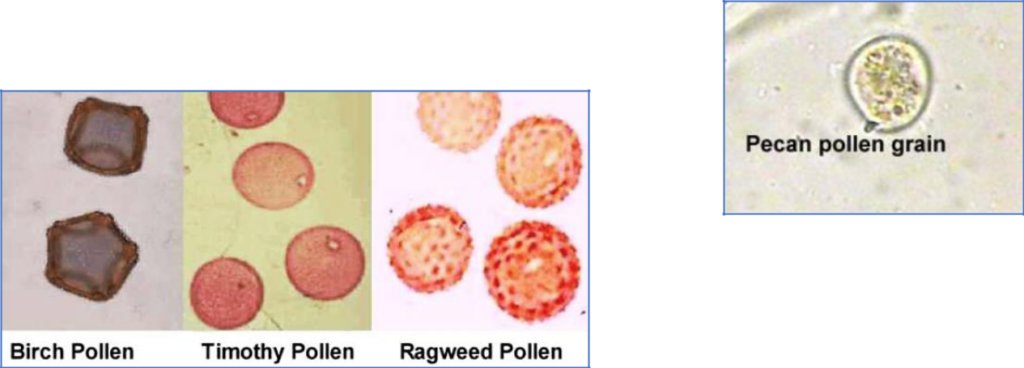
Particle analyzers that only measure size assume a perfectly round shape. However, many pollen particles have irregular morphologies. By integrating shape metrics—such as circularity, smoothness, and opacity—Dynamic Image Analysis helps researchers identify different pollen types more accurately and even distinguish between whole pollen grains and fragments.
Procedures to analyze pollen by particle size and shape
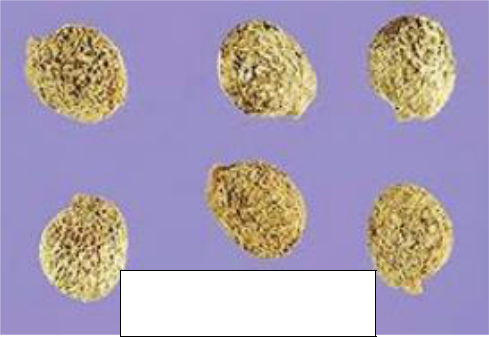
A collection of six distinct types of pollen samples were examined: Alder, Short Ragweed, Pecan, Redtop, Timothy Grass, and Paper Mulberry. Each sample was generated by dispersing them in water and subsequently mixing them before examination. Particle size-only apparatus will record information on the assumption that every particle embodies a round or spherical morphology. Assuming that all pollen particles are round will not allow a user to differentiate one species from another.
While assuming all particles are round may work for samples with uniform morphology, this approach falls short when dealing with particles that have irregular shapes. In such cases, size measurements alone are not enough. This study highlights how combining shape and size analysis offers a more powerful and accurate method for distinguishing between different pollen types.
The Particle Insight series can analyze thousands of particles within minutes, generating over 32 distinct size and shape parameters per particle. These advanced systems also support comprehensive statistical analysis, enabling users to classify pollen based on morphological characteristics such as circularity, smoothness, and opacity.
Timothy Grass Pollen
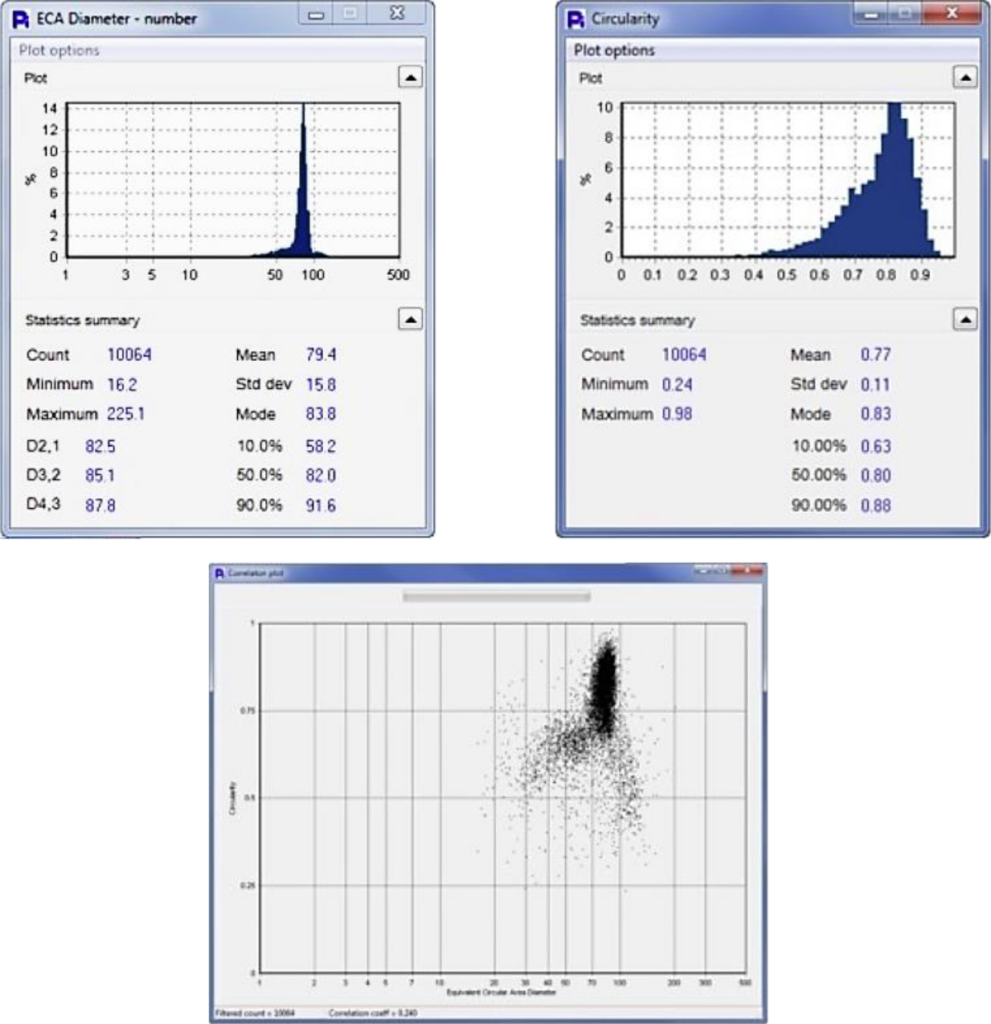
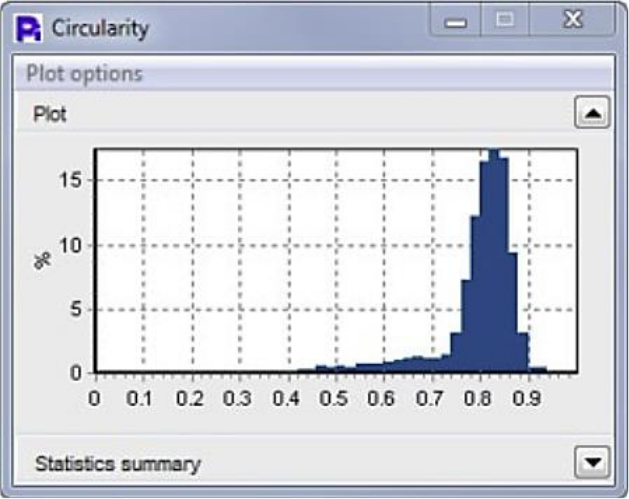
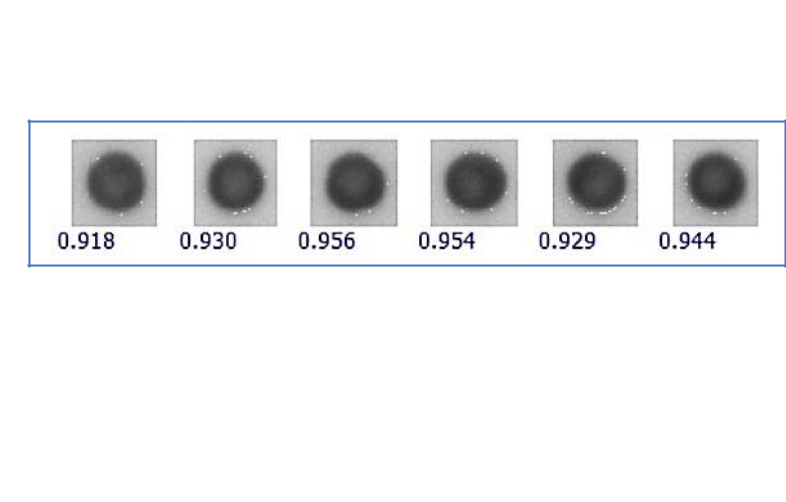
Timothy Grass pollen exhibited a unimodal size distribution, but a wide range of circularity values, indicating shape variation among particles. Thumbnail images confirmed the presence of both uniform, spherical pollen grains and irregular fragments or debris. Using the correlation plot, operators can compare two parameters—such as circularity and size—to highlight anomalies and better understand the morphological diversity within the sample.
Red Top Pollen
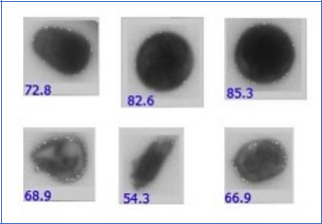
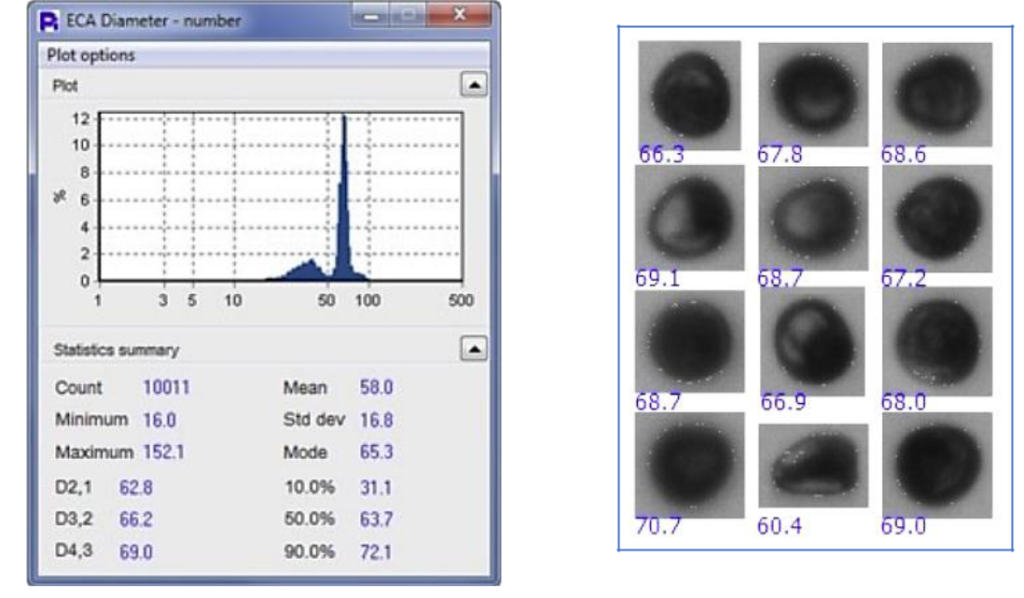
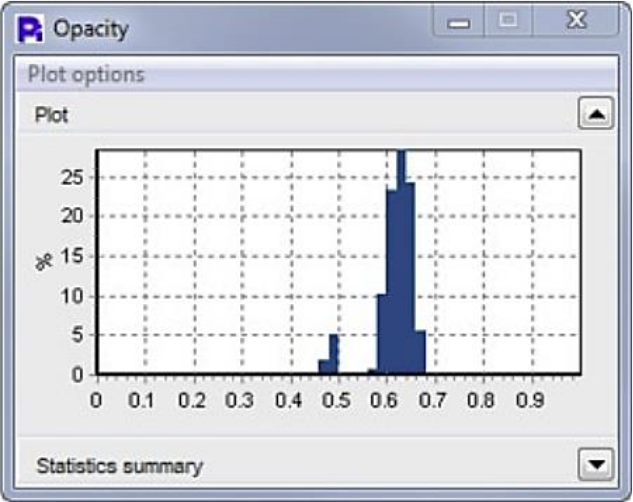
Red Top pollen grains appear uniformly dark in imagery but exhibit a bimodal opacity distribution, reflecting significant variation in internal particle density. Thumbnail images reveal a mix of intact pollen grains alongside fragmented particles and debris. Opacity, calculated as the average intensity of a particle on a scale from 0 (fully transparent) to 1 (completely opaque), proves to be a highly effective metric for distinguishing particle types within the sample.
The Pi Sentinel PRO system enables users to sort and analyze particles based on any measured parameter—including opacity. In this dataset, fragmented particles are not only visible in the image thumbnails but also statistically represented as smaller particles in the Equivalent Circular Area (ECA) Diameter distribution. A correlation plot further confirms that these lower-opacity particles also exhibit low smoothness, reinforcing their classification as non-uniform debris.
Paper Mulberry Pollen
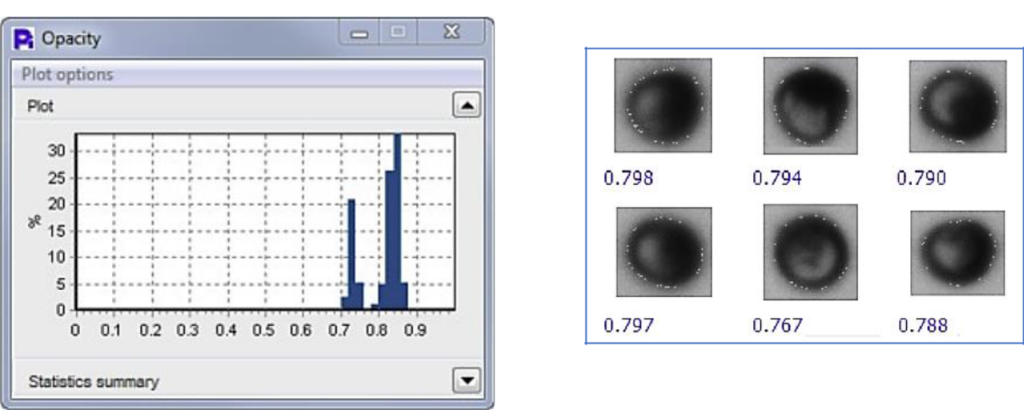
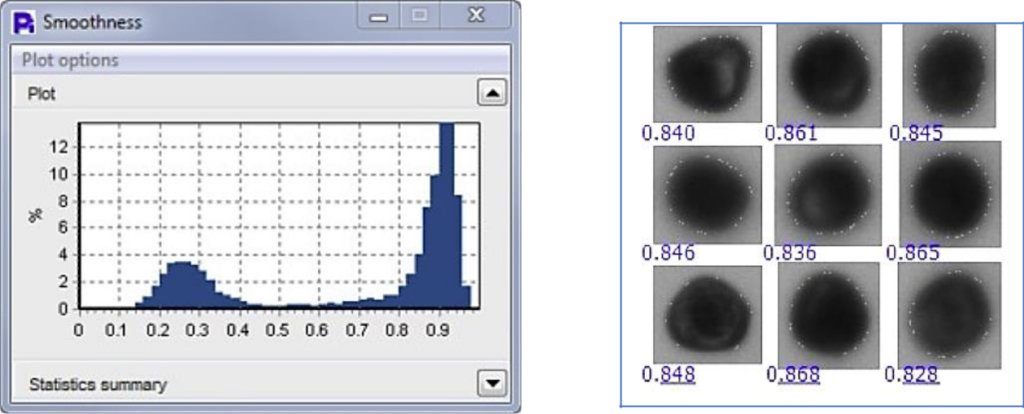
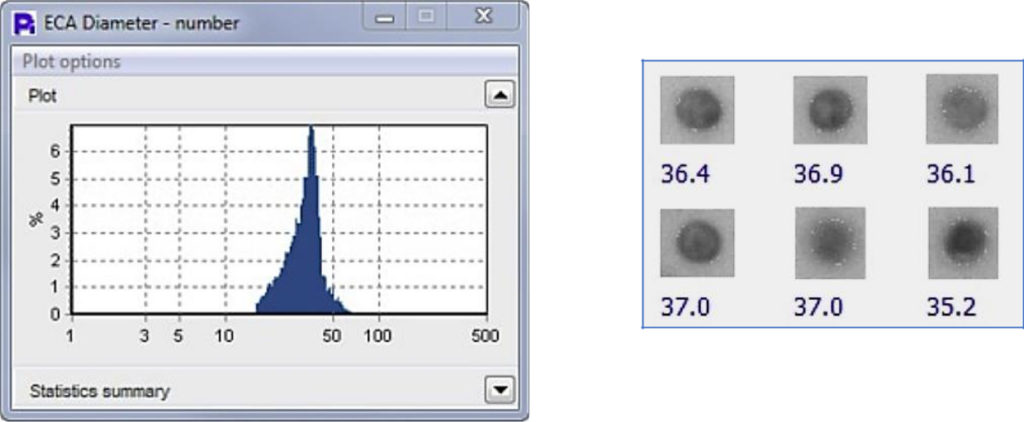
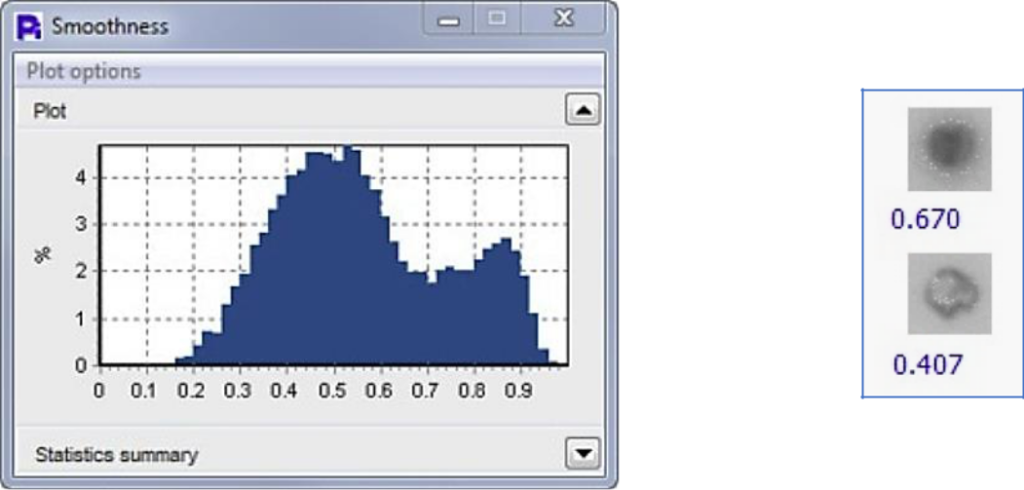
Paper Mulberry pollen exhibits a highly uniform size and opacity, as shown in the statistical histograms, indicating a consistent particle population in those dimensions. However, the smoothness distribution reveals a bimodal pattern, suggesting the presence of two distinct morphological subgroups. Thumbnail images support this observation—particles with lower smoothness values correspond to intact pollen grains that differ in overall shape, highlighting the value of shape analysis even within visually consistent samples.
Pecan Pollen
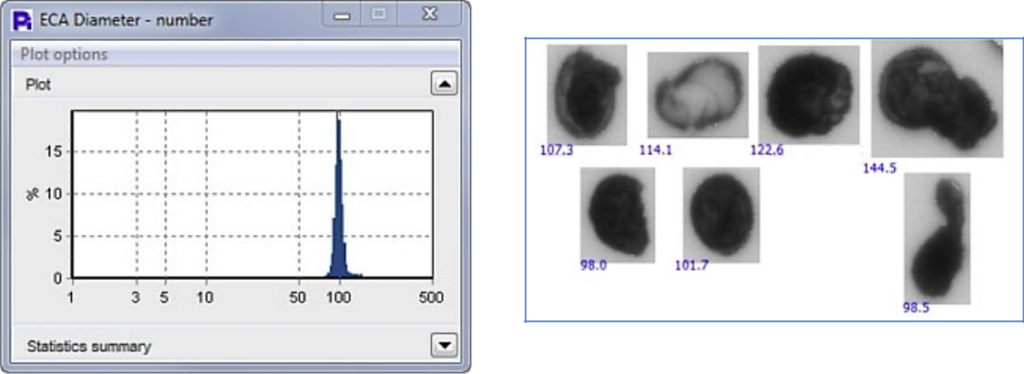
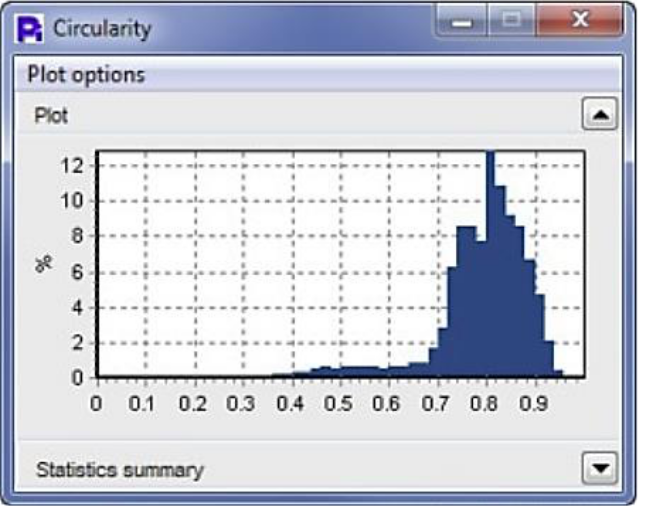
Pecan pollen clearly demonstrates that size data alone is insufficient for accurate particle characterization. While the Equivalent Circular Area (ECA) Diameter indicates a unimodal size distribution, suggesting uniform and spherical particles, deeper analysis tells a different story. When circularity, smoothness, and opacity are factored in, the sample reveals a wide range of particle shapes and textures. This underscores the limitations of relying solely on size measurements and highlights the importance of incorporating shape-based analysis to fully understand particle morphology.

Short Ragweed Pollen
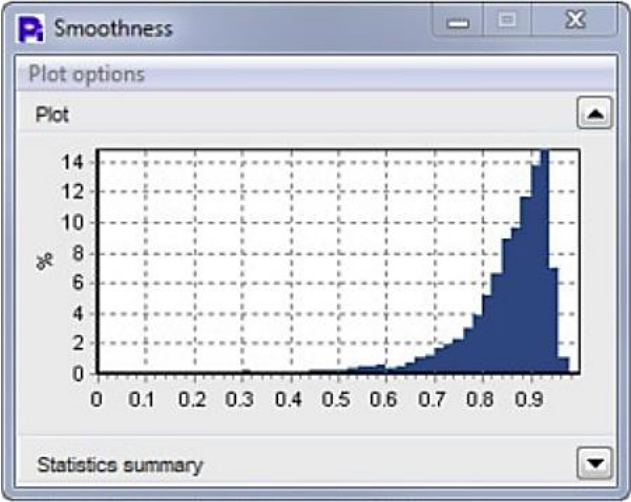
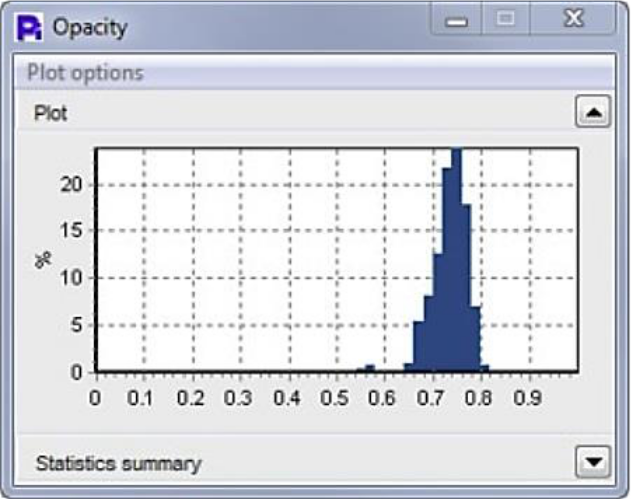
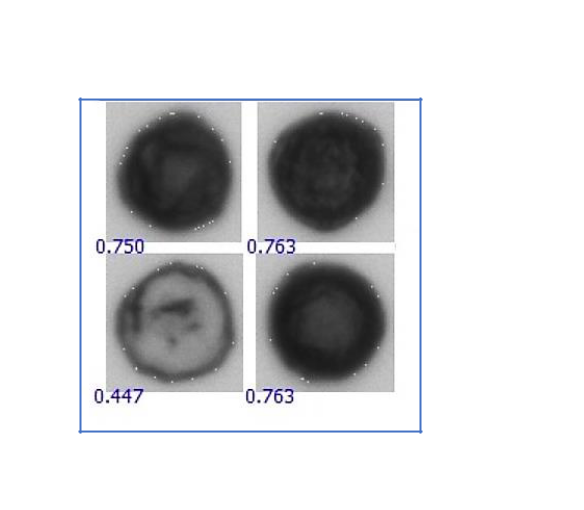
Short Ragweed Pollen embodies extremely homogeneous size, circularity, and opacity properties.


Alden Pollen
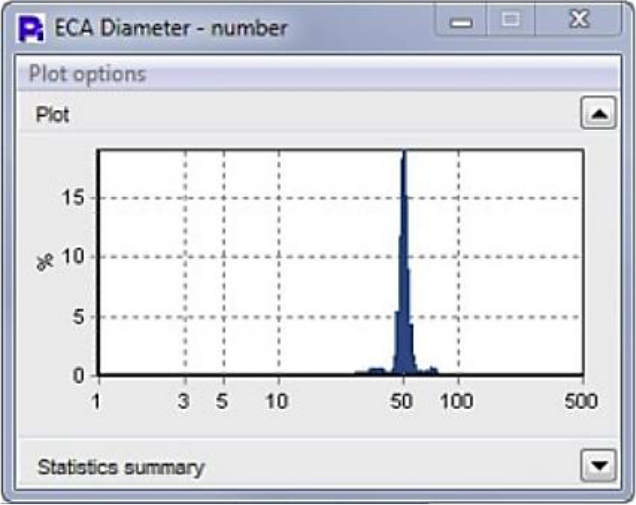
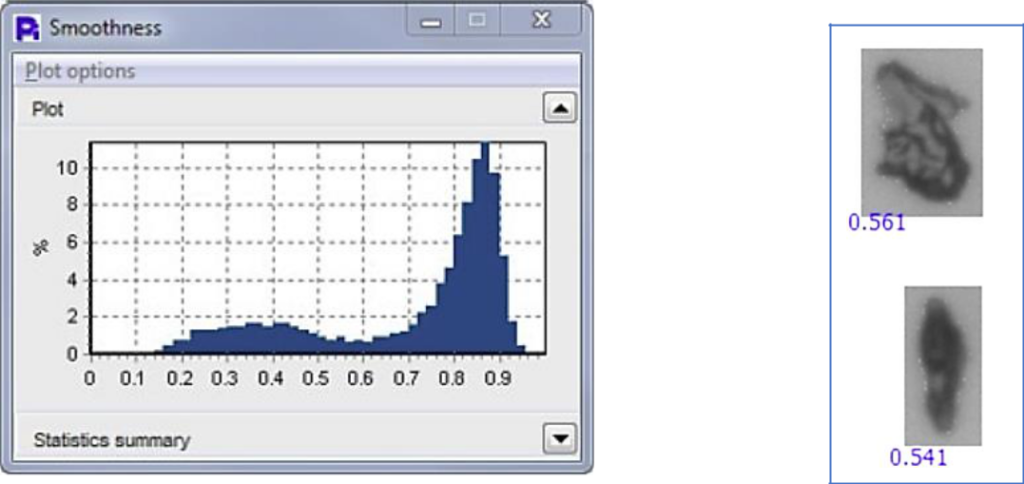
Alder pollen analysis reveals a notable proportion of particles with low smoothness, as shown in the distribution data. Thumbnail images confirm that this is primarily due to the presence of debris and contaminants, which differ significantly from the morphology of intact pollen grains. Identifying these irregular particles can help improve the pollen sample preparation process by highlighting areas where collection or filtration methods may need refinement.
Customizable Statistical Reports
The Particle Insight system performs real-time, high-speed analysis of thousands of particles, capturing detailed data for each one. Every particle is assigned a thumbnail image, along with corresponding shape measurements and frame identification, all of which are stored for further evaluation. This rich dataset can be exported in multiple formats and is complemented by comprehensive statistical histograms that illustrate key distribution patterns.
Additionally, the system can generate Excel reports for both individual samples and comparative studies, making it easy to visualize differences across datasets and streamline pollen morphology analysis workflows.
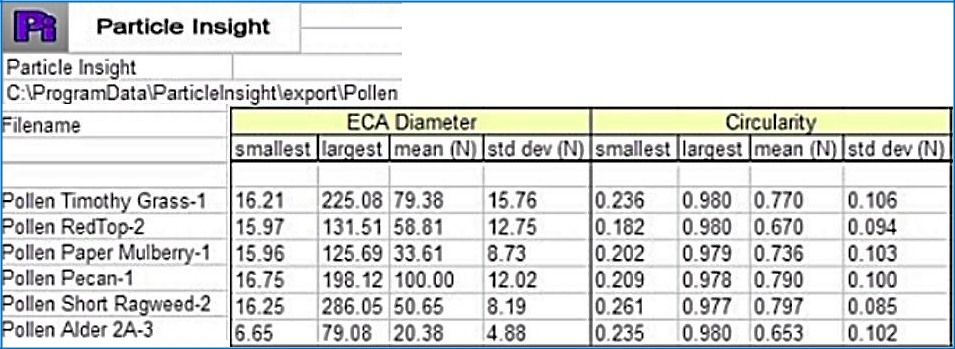
Undertaking an overlay of the total set of pollen samples, and correlating both their size and shape, enables a comprehensive comparison of how the pollen samples compare and contrast.
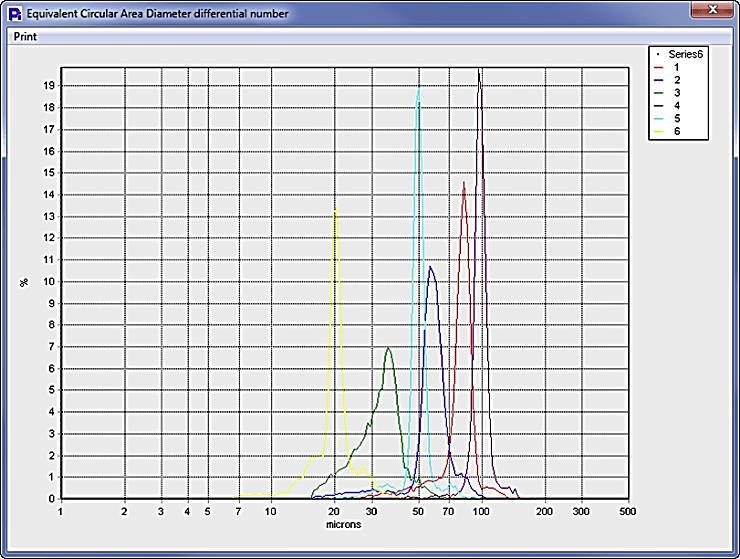
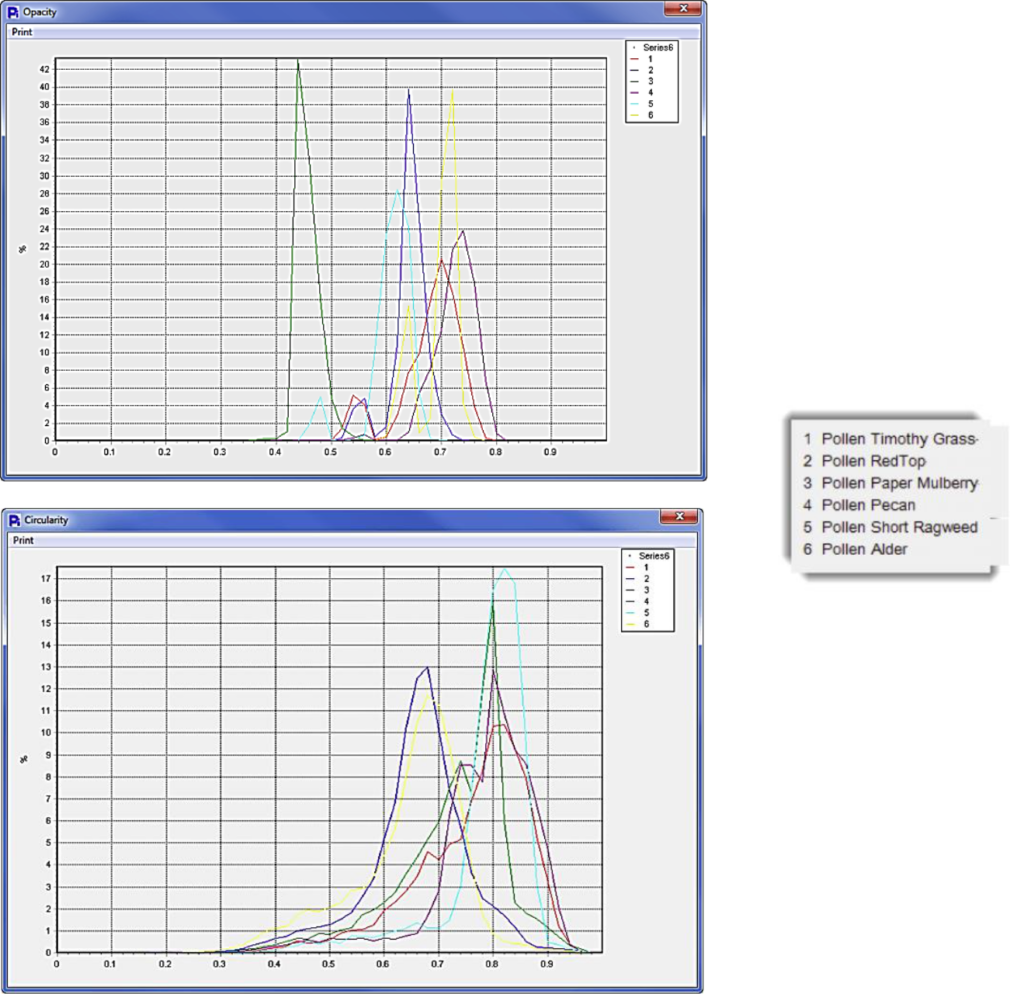
While all pollen samples analyzed showed relatively uniform particle size, their morphological characteristics—including circularity, smoothness, and opacity—varied significantly. These shape-based differences offer a powerful way to visually characterize and differentiate pollen types, enabling users to estimate the presence of cross-species contamination within a single sample.
The Particle Insight system includes a unique feature called Particle Classification, which automates this process by grouping particles based on defined shape parameters. This greatly enhances both accuracy and efficiency in pollen analysis workflows.
The comparative overlay diagram illustrates these distinctions clearly:
-
Most samples show moderate variation in opacity and smoothness.
-
Paper Mulberry pollen stands out with markedly divergent opacity and smoothness (highlighted by the green line).
-
Red Top and Alder pollen show significantly different circularity values, indicating distinct morphological profiles.
Conclusion
The analysis of six distinct pollen samples reveals that species differentiation is best achieved by evaluating both particle size and morphology. Characteristics such as circularity, smoothness, and opacity provide critical insights that size alone cannot. This approach not only distinguishes between species but also identifies dual populations within individual samples—especially in terms of opacity and circularity, which often indicate the presence of both intact pollen grains and fragments.
The Particle Insight system empowers users with over 32 size and shape analysis metrics per particle. In addition to quantifying particle concentration, it supports flexible data reporting and advanced pollen classification, making it a comprehensive solution for high-resolution particle characterization.
The Particle Insight Products enable the operator to not only have 32+ size and shape analysis measures for every particle examined, but also to report concentration and record data in multiple ways including classification of pollen types.
For a deeper understanding of dynamic image analysis, visit our Principle of Operation – Dynamic Image Analysis page
To learn more about Morphology and Pollen, please visit “Morphological Characteristics of Pollen Grains”

