Particle Shape Analysis of Portland Cement
Portland cement is a meticulously engineered blend primarily composed of calcium, silicon, aluminum, and iron, with minor quantities of other elements. During the final grinding phase, gypsum is added to adjust the setting time. Notably, lime and silica constitute approximately 85% of the cement’s mass. Common raw materials in its production include limestone, shells, chalk, shale, clay, slate, blast furnace slag, silica sand, and iron ore.
Importance of Particle Shape in Cement Performance
The performance characteristics and setting time of Portland cement are significantly influenced by the efficiency of chemical reactions among its components. A critical factor affecting these reactions is the particle shape of the constituent materials. Understanding the particle shape distribution is essential for predicting the behavior of the final cement product.
Traditional non-imaging particle size analysis tools often assume particles are spherical, which can lead to inaccuracies in assessing how particles will behave during production and application.
Utilizing Imaging Techniques for Particle Shape Analysis
Advanced imaging techniques, such as those offered by the Pi Sentinel PRO, enable the differentiation of particle sub-populations based on size and shape. This approach provides a more comprehensive understanding of the sample’s composition.
For instance, a typical “diameter” histogram generated by the Pi Sentinel PRO might display a smooth size distribution centered around 30 µm. However, examining particle images reveals a variety of shapes, indicating the presence of multiple particle types within the sample.
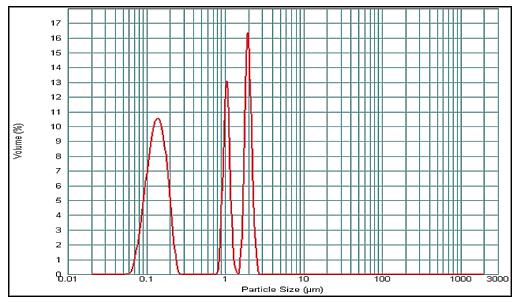
Typical Size-Only results from Laser Diffraction systems
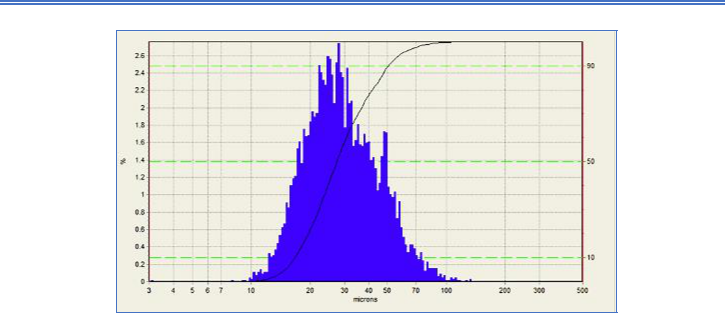
Dynamic Imaging will also report particle size both number-weighted and volume-weighted.
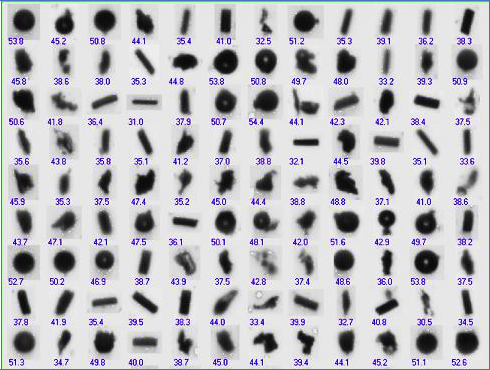
In looking at a sampling of the particle thumbnails, it is obvious that this sample is made up of more than one kind of particle shape. The “diameter” data may mislead the user into thinking the particles are all the same type when they are not.
Procedures and Findings
The following Particle Insight data indicates a selection of the size and shape outcomes for the Cement sample.
These represent overall results for the total sample.
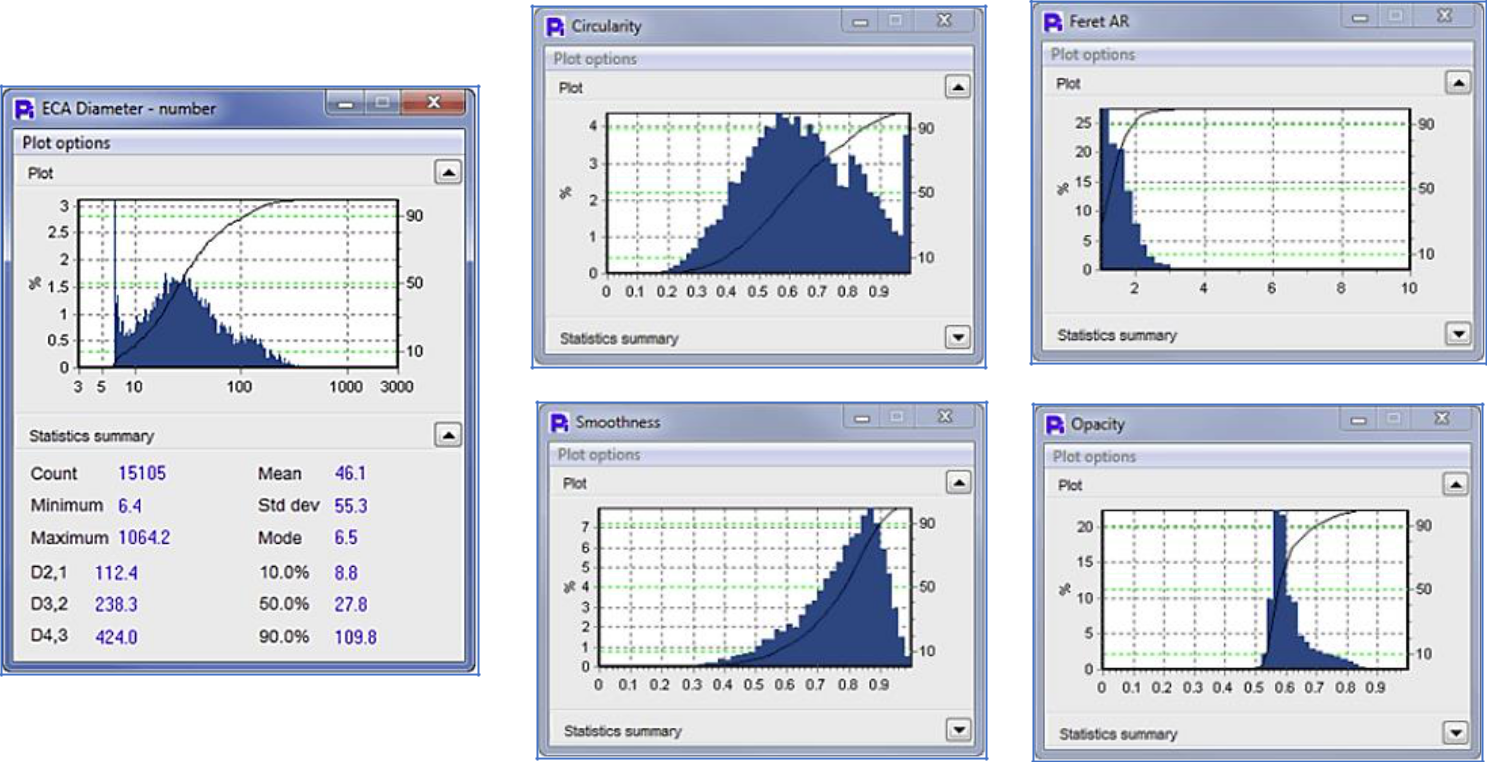
The Particle Insight provides detailed size and shape data for cement samples, offering insights into the overall sample characteristics.
By analyzing parameters such as “Smoothness,” particles can be categorized into “smooth” and “rough” groups. This classification becomes evident upon reviewing particle images, where the distinction between subgroups is clear. Setting a Smoothness threshold (e.g., 0.84) allows for effective separation of these subgroups.
The post-run processing capabilities of the Particle Insight facilitates the visualization of distributions for various measures across all particle subgroups. Users can also examine particle images and generate correlation diagrams between different measures.
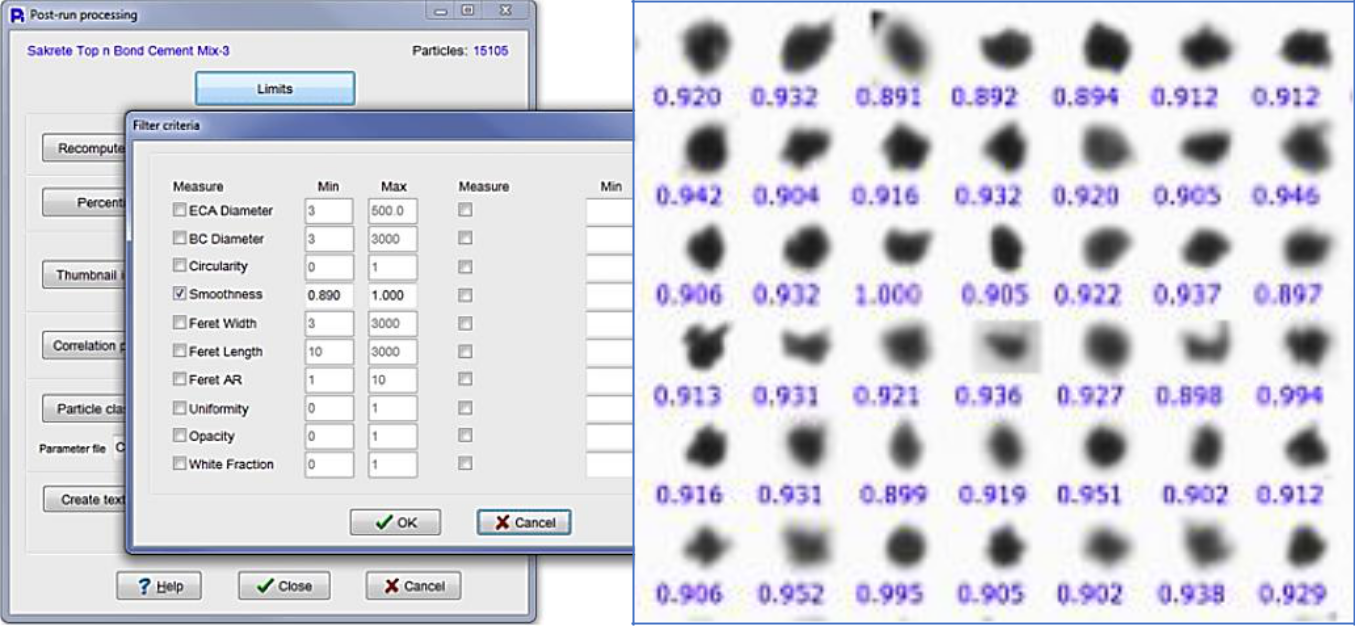
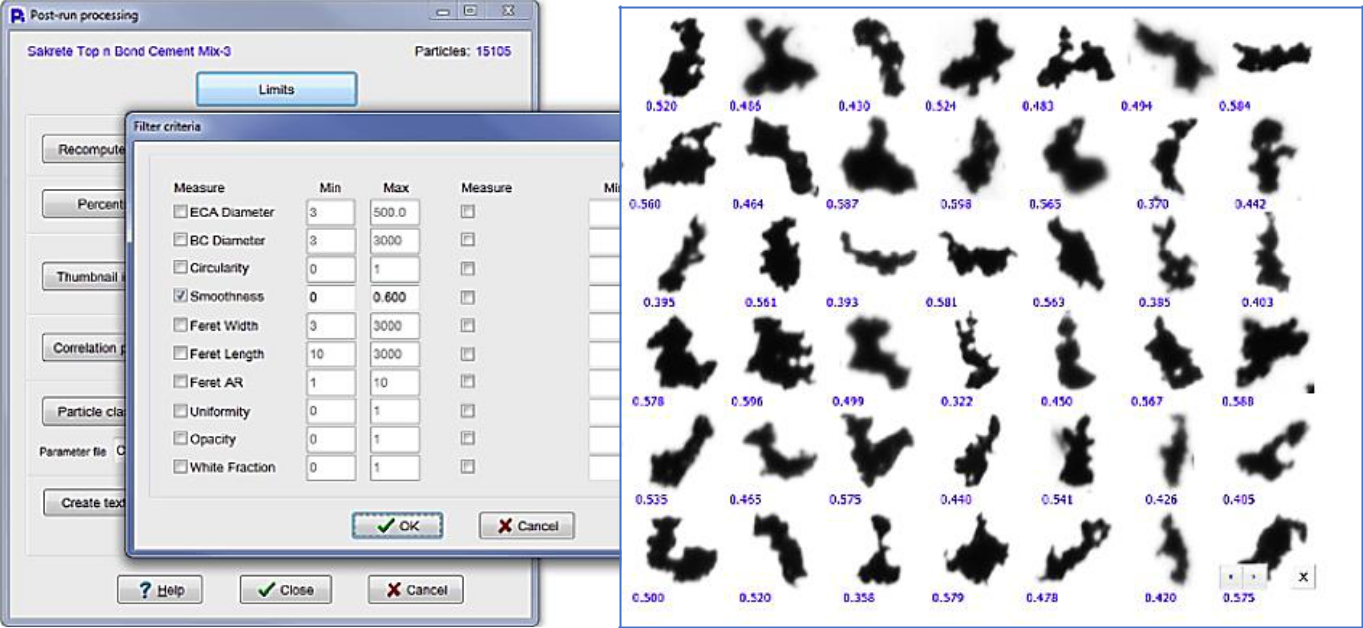
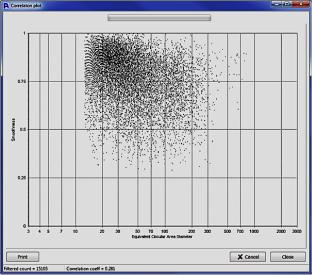
Focusing on the “very smooth” subgroup, applying a lower Smoothness limit of 0.89 during post-run processing isolates this category. Conversely, setting a lower limit of 0.60 highlights the “very rough” subgroup. Scatter plots further illustrate the relationship between particle smoothness and size, often revealing an inverse correlation—smaller particles tend to be smoother.
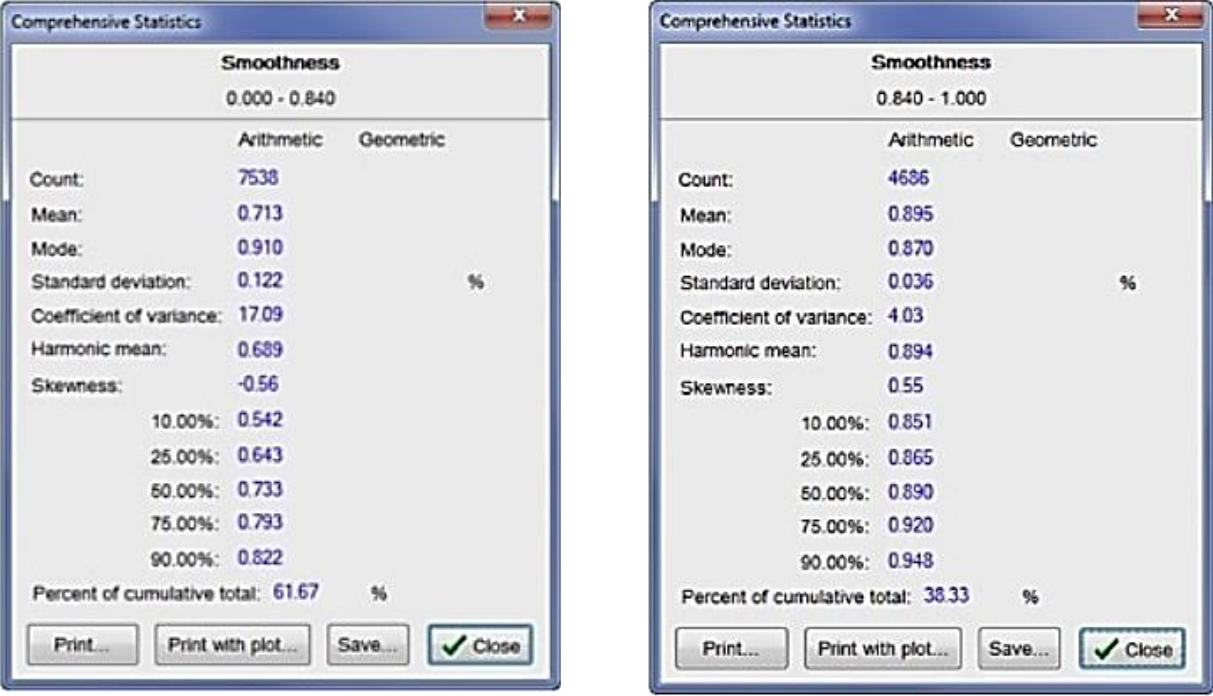


In addition to the statistics overview presented herein, the Pi Sentinel PRO Post-run processing function enables the presentation of the total distribution of any, or all, of the measures utilized, for all particle subgroups. It also permits the observation of particle thumbnails and two measure correlation diagrams.
Taking the “very smooth” subgroup as the sole focus, a lower limit of 0.89 on Smoothness can be implemented in the post-run processing function.
To specifically examine the “very rough” subgroup, a lower limit of 0.60 on Smoothness can be implemented. It is also possible to observe an interdependence between particle smoothness and generalized size.
The scatter graph demonstrates that there is an inverse correlation between smoothness and size; the smallest objects are the smoothest ones. The interdependence of any two size or shape measures with each other can be correlated by the Particle Insight post processing.
Conclusion
In-depth particle shape analysis of Portland cement is crucial for optimizing its performance characteristics. Employing advanced imaging techniques, such as those provided by the Pi Sentinel PRO, allows for precise classification and quantification of particle subgroups. This detailed understanding aids in predicting and enhancing the behavior of the final cement product.

