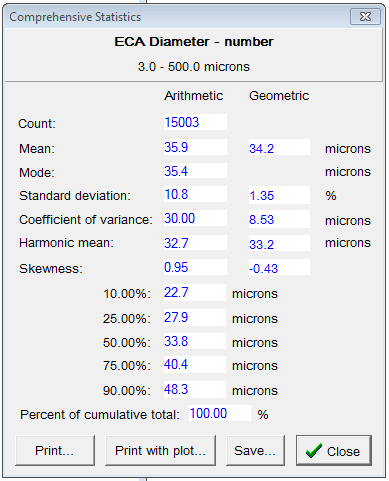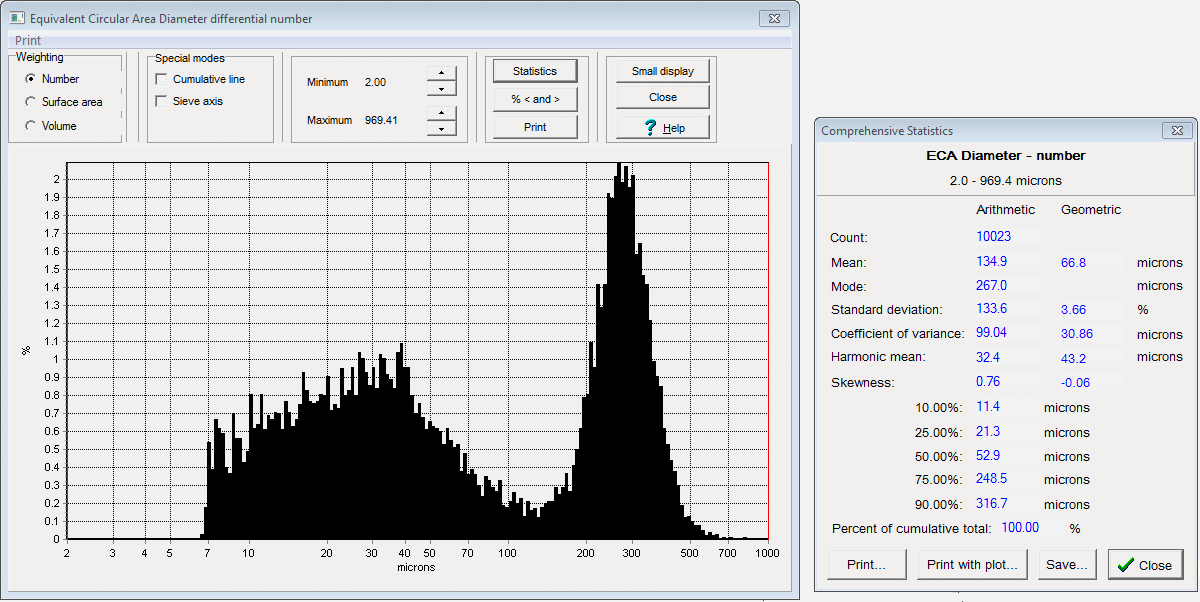
The Comprehensive Statistics window characterizes the sample in greater detail, using commonly-accepted statistics for histogram data. The Arithmetic values come from the original data and correspond visually to what the histogram would look like on a linear size axis. Geometric stats reflect the appearance of the distribution on the log axis.
Mean is the average size; Standard Deviation is a measure of the amount of spread; Mode is the most frequently-seen size.
Coefficient of Variance is a normalized measure of spread or dispersion, and is calculated as Std Deviation divided by Mean. Skewness is a measure of asymmetry, and can be positive or negative depending on which side of the mean the bulk of the values lie.
The Percentile values give further information on how the sizes are distributed. In this example 10% of the counts are below 22.7 microns; 25% of the counts are below 27.9, etc.
Analyzing a subrange

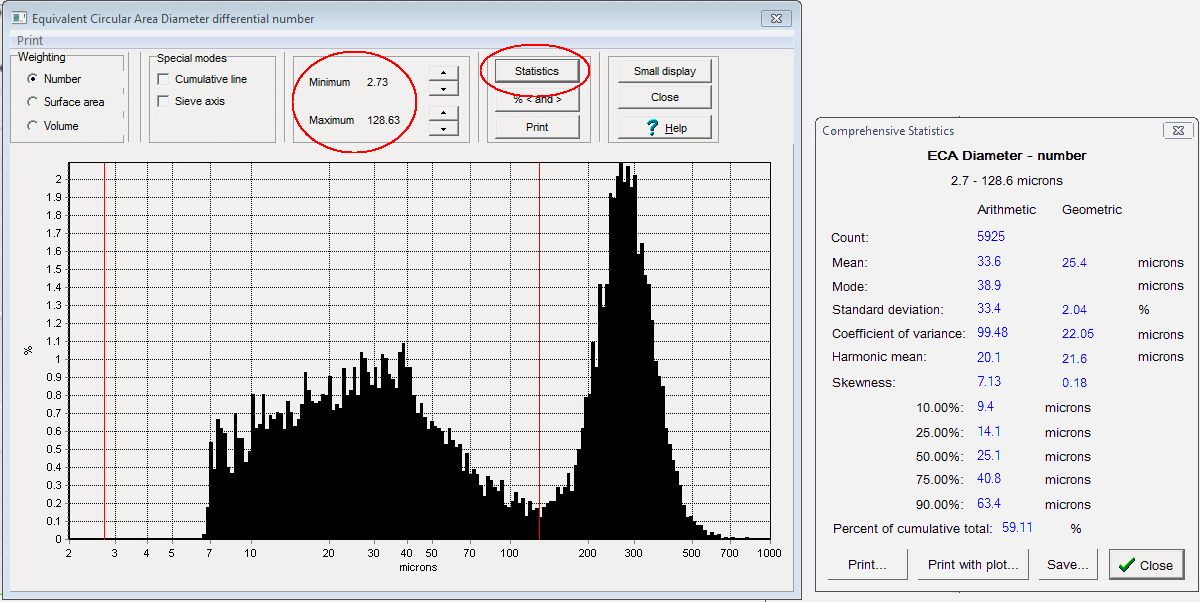
Bimodal (double-peaked) distributions often mean there are two kinds of particles present. How do we separate out the statistics for the two kinds? In the Large data window you can reduce the range on the X axis for which statistics is computed. In the graph window below, the range for statistics is restricted to 2.7 to 128.6 microns. Click on Statistics to get the statistics report for that subrange. Particle count for the lower peak is 5925, compared to the total count of 10023.

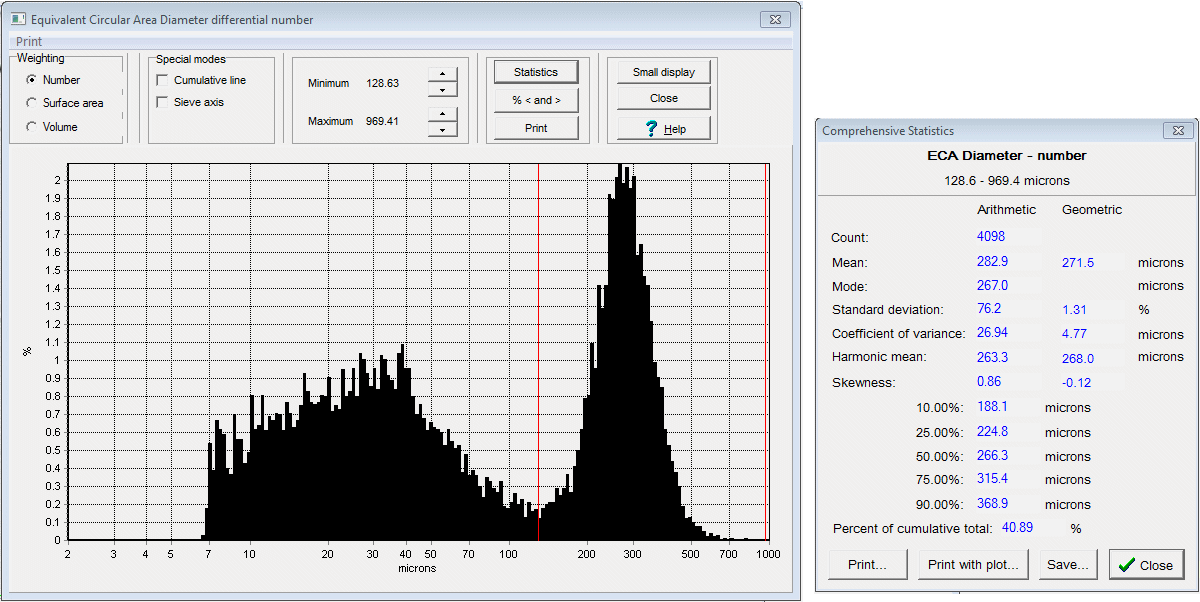
Similarly, below we show how to report statistics for the upper peak.

If there are two kinds of particles present in a sample and they have similar sizes but different shpaes, they can be separated using shape filtering.

