Separating Subcomponents of a Sample
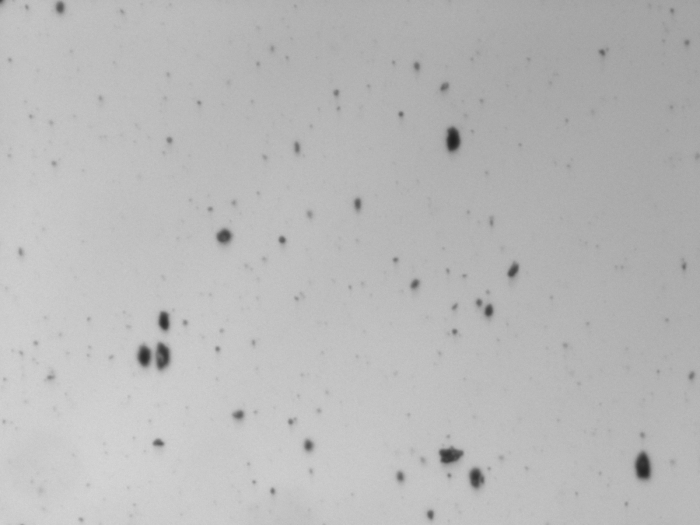
Some of the examples in the Software section used artificially-prepared mixes of spheres and another kind of particle, for the sake of obviousness. Here we will look at a real-world sample that consists of two classes of particles. In the typical raw image shown below, there are small round particles together with larger, more irregular objects. (All particle and thumbnail images are reduced by about 1/3 in the x and y dimension, in this presentation.)
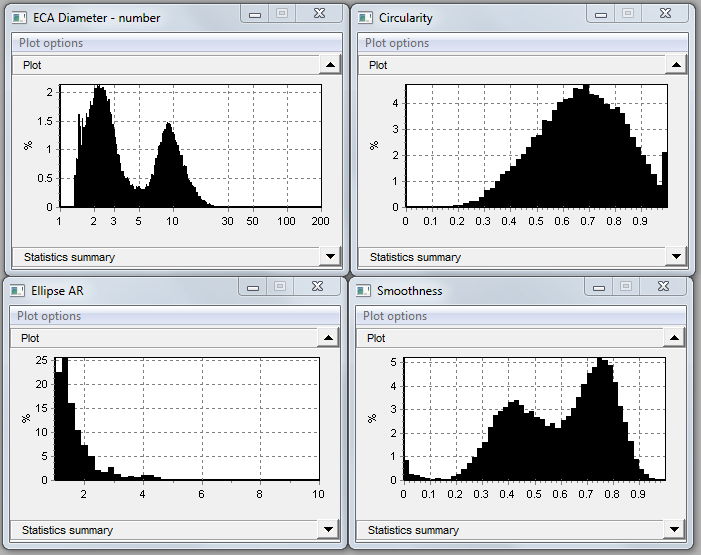
Above, we see frequency distributions for four measures, for this sample. The ECA diameter graph shows a bimodal distribution, probably representing the two kinds of particles observed in the raw image.
The task at hand is to extract separate size and shape statistics on the two sub-classes of particles. Three ways of accomplishing that task will be shown here.
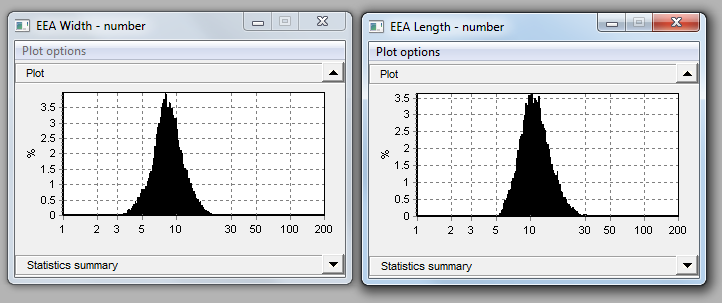
Before we start, note that the ellipse width and length graphs are almost identical, confirming that most of the particles have aspect ratio (length/width) close to 1. But that does not necessarily mean that they are spherical.
Single Measure Analysis
Below is the “large data window” for the ECA diameter. Also shown are statistics for the complete size range. The particle count is about 50,000, which is large enough to produce smooth distributions in the measure graphs. The dotted red lines indicate the likely overlapped parts of the two particle classes.
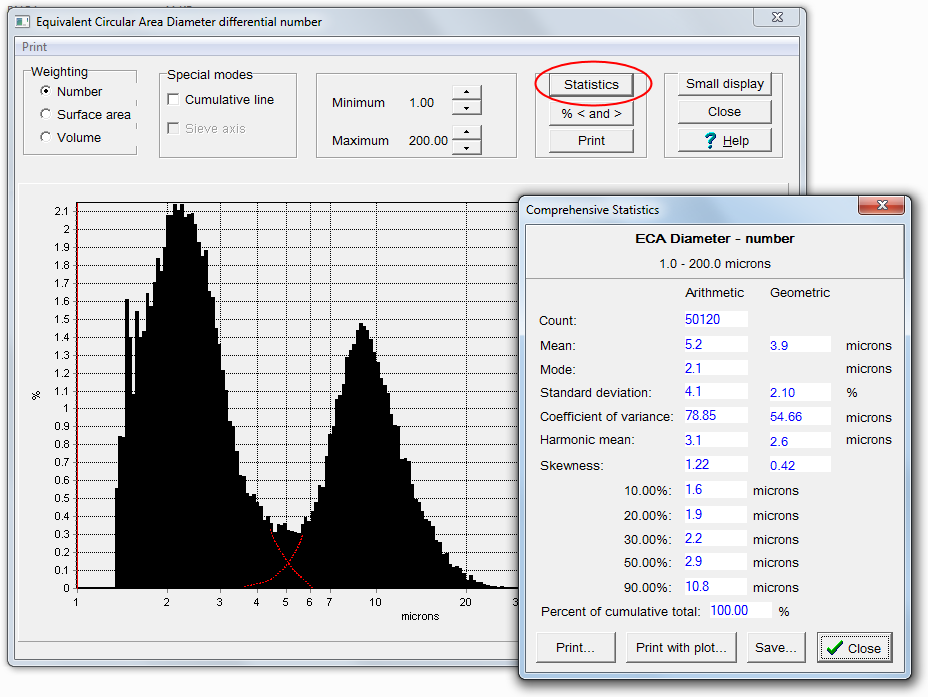 We can split the ECA distribution into two parts, to obtain a fairly good picture of the two classes of particles. Because of the overlap the two parts will each contain a small amount of data from the other size class. Below we close down the size range to that part of it that is below 5 microns, to isolate the first peak.

The smaller particles are seen to number about 31,000, and represent about 63% of the total, by number. The mean size is 2.5 microns and the median is 2.2 microns. The distribution is skewed slightly to the right (skewness > 0).
 In the graph above, we have restricted the size range to that part which is above 5 microns. These are the larger objects we see in the raw image. Particle count is about 18,000, representing 37% of the cumulative total by number. The Mean is 9.8 microns. Skewness shows as slightly positive, because the lower-end tail is cut off. In actuality, the distribution is probably pretty close to normal (unskewed).
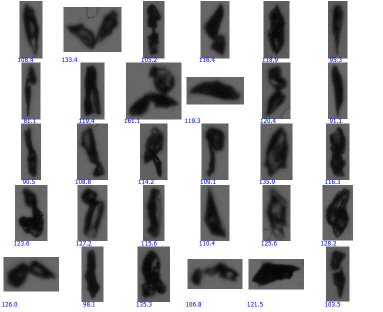
This page of particle thumbnails for objects greater than 5 microns shows that they are irregular in shape.

Multi-measure Analysis
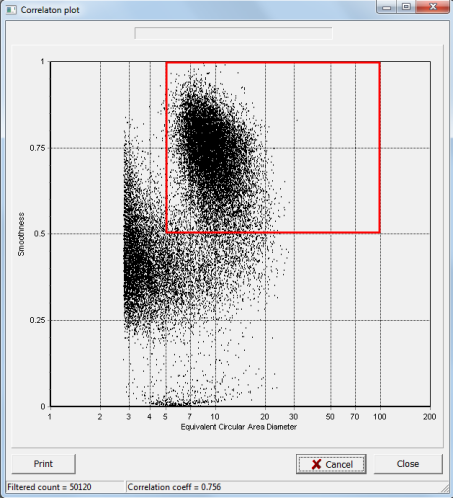
By taking into account other measures besides ECAD we may be able to separate the two particle classes more accurately. From the original Smoothness graph it looks like the two classes may have different smoothnesses. To confirm that, we can look at the correlation between ECAD and Smoothness:
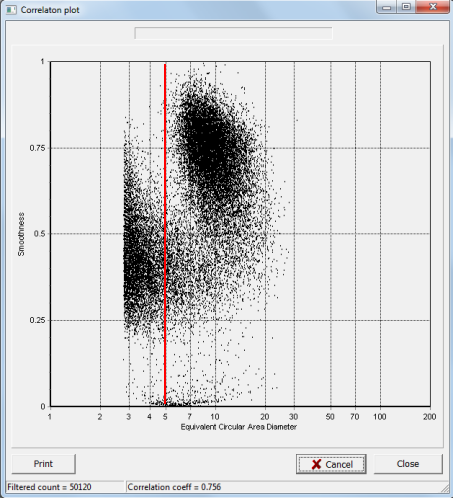
The two subpopulations show clearly in this scatter chart, although even here there is some amount of overlap. It is obvious from this chart that the larger class of particles are smoother on their surface than the smaller group. The red line represents the division of the sample into two parts that we did in the single-measure analysis. You can see that a fair number of “group 1” particles (the lower size group) actually got counted in group 2 in that method.
Is it possible to do a better job of separating the two parts? If you restrict ECAD to be > 5 and Smoothness to be > 0.5, then you take just the particles that are inside the red box below.
To do that, use the Particle Insight post-process reanalysis tool. Enter those restrictions in Limits:
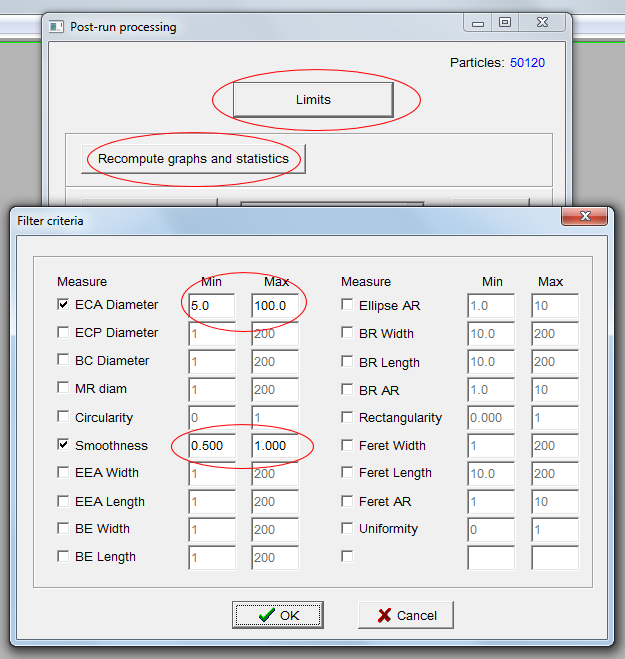
Click ‘Recompute graphs and statistics’ to regenerate all statistics. The resulting ECAD graph is probably pretty close to the actual size distribution in the upper group, and more accurate than simply taking the upper part of the original ECAD distribution.

Finding a rectangle that contains the lower size group is trickier, but ECAD < 8 microns and Smoothness < 0.6 catches most of them.
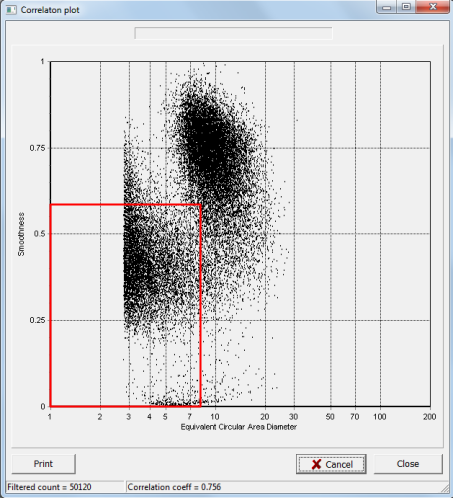
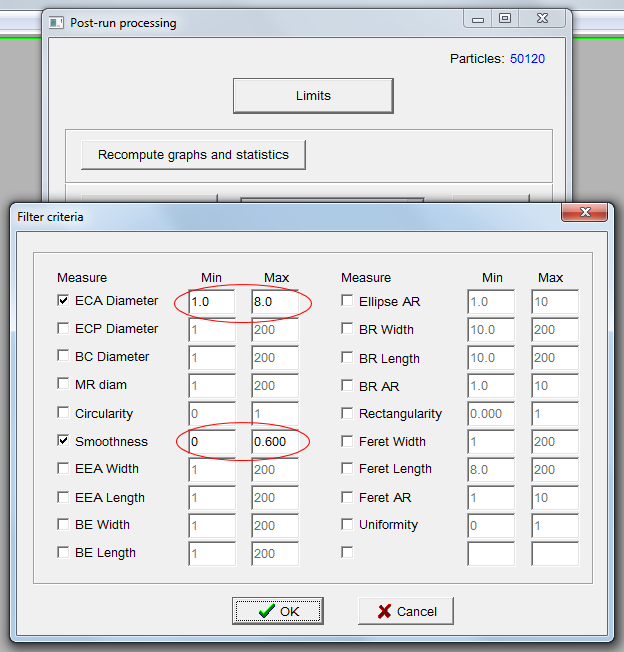
This class of particles is seen to be highly non-normal, with most particles at the low end. This is typical of very fine particles, both solid and liquid.
 There is a small overlap area that the two rectangles have in common, meaning that a few particles have been counted in both classes. But this technique does a reasonably good job of separating the classes, especially the group 2 (larger) class.
Particle Classification
The Classification tool in Post-Processing can do the same separation just described above, except that there are fewer steps. Define two classes as shown below:

Click OK, and a brief statistics summary is listed for each class:
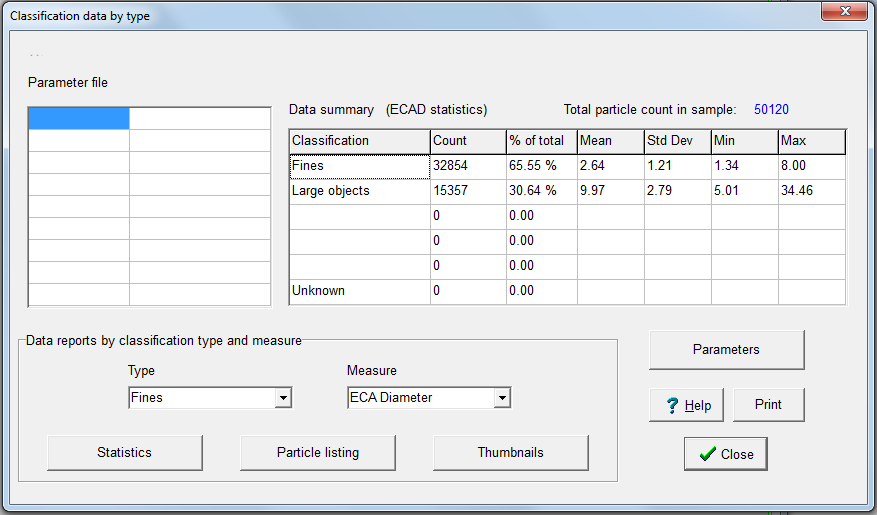
If I click Statistics, with Type equal to Fines, and Measure set to ECAD, I will get the same regeneration as I got before using ‘Recompute graphs and statistics’ for ECAD. To get results for the Large Objects class, just set Type to Large Objects and click Statistics again.
Further examples of these procedures can be found in the other application notes in this section.
Also see the video Separating subcomponents of a sample
PARTICLE SHAPE APPLICATION EXAMPLE: Polystyrene spheres
The challenge
Obtain accurate size distributions of polystyrene spheres, ranging in diameter from about 3 to 125 microns. Number, surface area and volume weighting are calculated.
Applicable measures
Measure
Equivalent circular area diameter
![]() Circularity
Circularity
Range of acceptance
3 – 500 microns
0 – 1.00
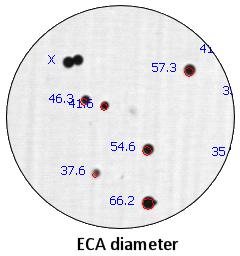
Typical image

Notes
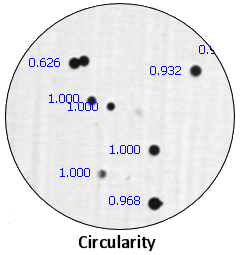
ECA diameter is the diameter of a circle having the same projected area as the actual particle. With spheres, it is the natural measure to use. Beads sometimes cluster together – how do we eliminate those from the analysis? By using shape rejection: any object having a circularity value below 0.80 is ignored. In the sample image, there is a double that shows a circularity of 0.626 (we turned off the rejection temporarily to show the value). That cluster is bypassed in the data accumulation.
Results
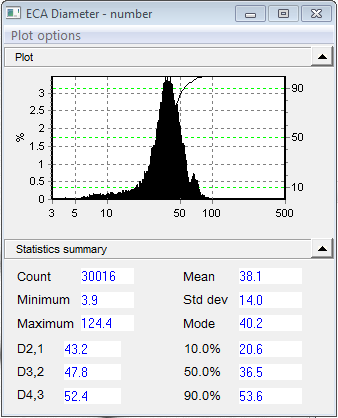
The ECA histogram graph shows that the particles do not have a simple normal distribution; there is a tail of small particles on the left side, and a secondary peak at around 60 microns. The accepted (in-focus) particles ranged in size from 3.9 to 124.4 microns. The mean, in this case 38.1, is often used as a “single number” characterization of a sample. The percentiles (10%, 50%, 90%) give more information of how the data is distributed about the mean.
The logarithmic size axis gives a better visual representation of the distribution near the low end than a linear axis would. It “stretches out” the low end.


When the distribution is weighted by surface area, the low-end tail disappears because those particles contribute essentially nothing to the total surface area. The small peak at 60 is larger because it now represents a larger fraction of the sample surface area. The whole distribution shifts right slightly.
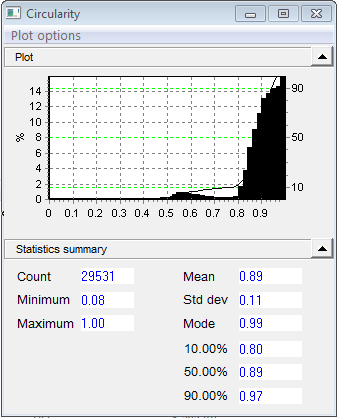
This Circularity plot shows the circularity histogram when shape rejection is turned off. A check of particle thumbnail images shows that the counts below 0.8 represent clusters of spheres. When shape reject is set up to bypass objects with circularity less than 0.8, that part of the circularity histogram disappears. If the small peak at 60 microns in the size graph goes away under the shape rejection, you can conclude that it represents these particle clusters.
The Comprehensive Statistics characterize the sample in greater detail, using commonly-accepted statistics for histogram data. The Arithmetic values come from the original data and correspond visually to what the histogram would look like on a linear size axis. Geometric stats reflect the visual appearance of the distribution on the log axis; for example the graph is skewed right in one case and left in the other.

The volume graph shows the same effects, to an even greater degree. Volume weighting is used when the volume of individual particles most affects what happens, such as in some chemical reactions.
PARTICLE SHAPE APPLICATION EXAMPLE: Cellulose fiber properties
The challenge
Here we study the properties of certain cellulose fibers from natural sources. They are sold as thickening agents in a variety of household consumer products such as cosmetics, shampoos, etc. Length, width (thickness) and curl strongly affect the viscosity of the final product.
Applicable measures
Measure
![]() Fiber Width
Fiber Width
![]() Fiber Length
Fiber Length
![]() Fiber Aspect Ratio
Fiber Aspect Ratio
![]() Fiber Curl
Fiber Curl
Range of acceptance
5 – 500 microns
10 – 1000 microns
1.0 – 50.0
0 – 1.00
Typical image
Notes
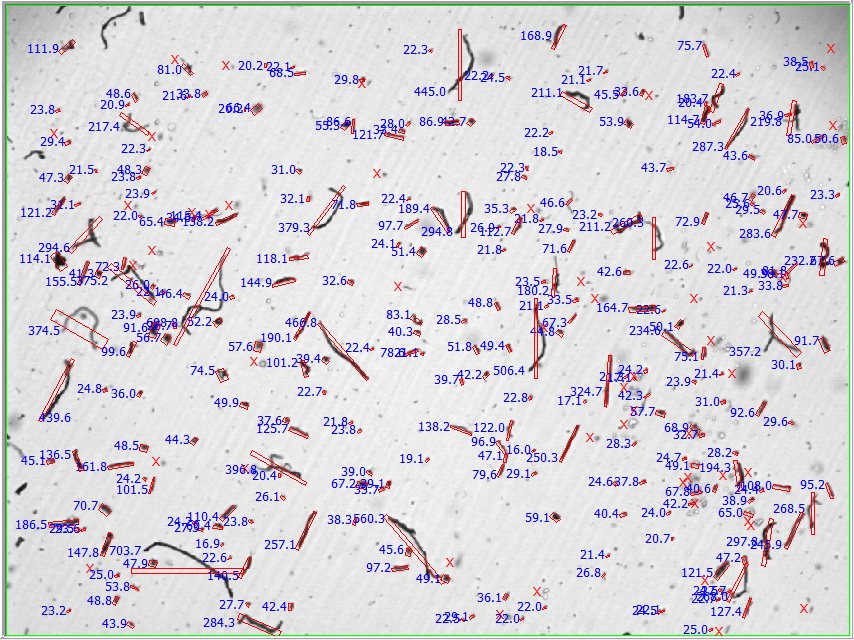
Fibers of this type are suspended in propanol to prevent rapid dissolution, and then mixed well. Because long fibers tend to align themselves with the direction of flow, lengths longer than the width of the flow cell can be handled.
The image above shows Fiber Length values. The fiber shape model straightens out long thin fibers and reports length, width, and aspect ratio of the straightened rectangle.
Results

Fiber Width is symmetrical about the mean (16 microns). Fiber Length shows a sharp rise and then a straight dropoff down to 500 microns. The dropoff is almost linear (on the log scale). Fiber length distributions typically do not conform to the usual particle size distribution shapes.
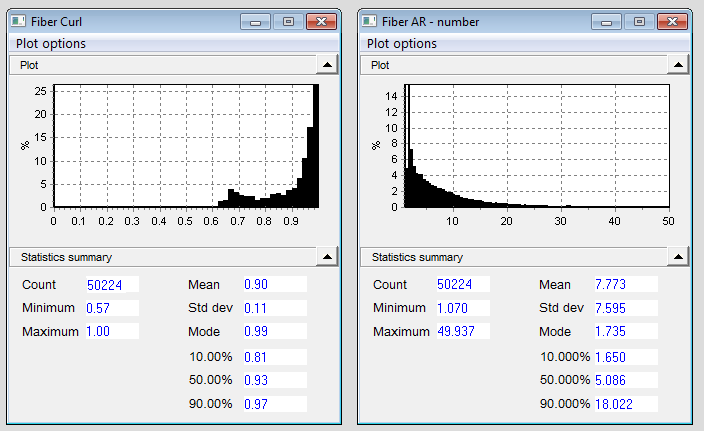
Curl is actually a measure of straightness, numerically — 1.0 is perfectly straight; lower values mean more curl to the shape. Aspect ratio, the ratio of length to width, shows a mean value of 7.7. The largest aspect ratio seen was about 50.
PARTICLE SHAPE APPLICATION EXAMPLE: Chromatography Packing Materials
The challenge
High Performance Liquid Chromatography is a separation technique used in analytical chemistry to separate, identify, and qualify various compounds in a solution. Most traditional analytical HPLC packing materials have an average diameter of approximately 2 to 30 microns. The particle size of the packing material is usually measured using methods that assume all particles are uniformly spherical. This may not be the case; fines and irregular shaped particles can be a percentage of the final product. As particle size decreases, the effect of fines and irregular shaped particles demands a greater degree of control on incoming quality of the silica material. Variation in particle shape can directly affect reproducible performance. What is needed is a way to quantify the fines and non-spherical particles.
Applicable measures
Measure
![]() Feret Width
Feret Width
![]() Feret Length
Feret Length
![]() Feret Aspect Ratio
Feret Aspect Ratio
Range of acceptance
3 – 100 microns
3 – 100 microns
1.0 – 30 .0
Typical thumbnail page
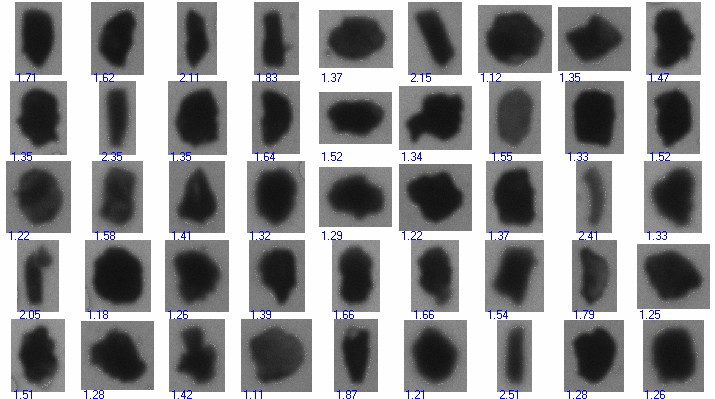
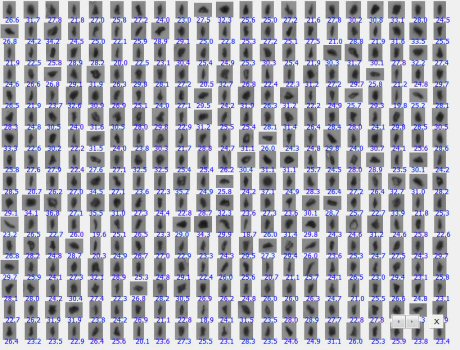
Random thumbnail images of the alumina sample from the 10,000 captured in just over one minute. The value under each thumbnail represents the Feret Aspect Ratio of the particle.
Procedures and Results
Proper sampling of the incoming materials was made to ensure a homogeneous sub-sample. The sample was then suspended in water and analyzed. After analysis and a review of all particle thumbnail images, it was evident that this alumina sample had two distinct shape populations. One was rod-shape and the other had an aspect ratio near unity, but the particles were not round. Had the sample been analyzed using a sizing technique that assumes all particles to be spherical, these rod-like and irregular particles would not be differentiated.
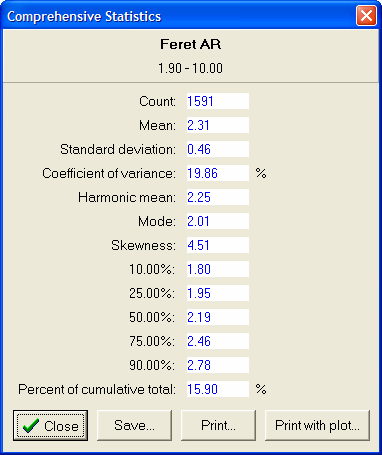
In developing a method for this sample, particles with an aspect ratio greater than 1.9 were considered to be rod-like and more likely to negatively impact the packing efficiency of the column. This aspect ratio value threshold was derived from sample lots that did and did not exhibit the problems previously described.
As shown in the histogram and statistical data, the percentage of rod-like particles in this column packing material was 15.90% of the total distribution which, compared to the historical lot of good material, proved to be excessive for the particular column application.
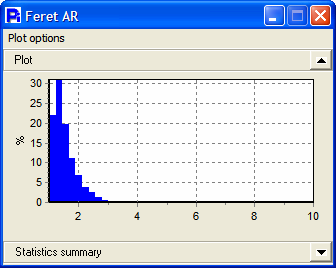
A review of the thumbnails for only those particles that have a Feret Aspect Ratio greater than 1.9 gives a better perspective on what these particles actually look like.

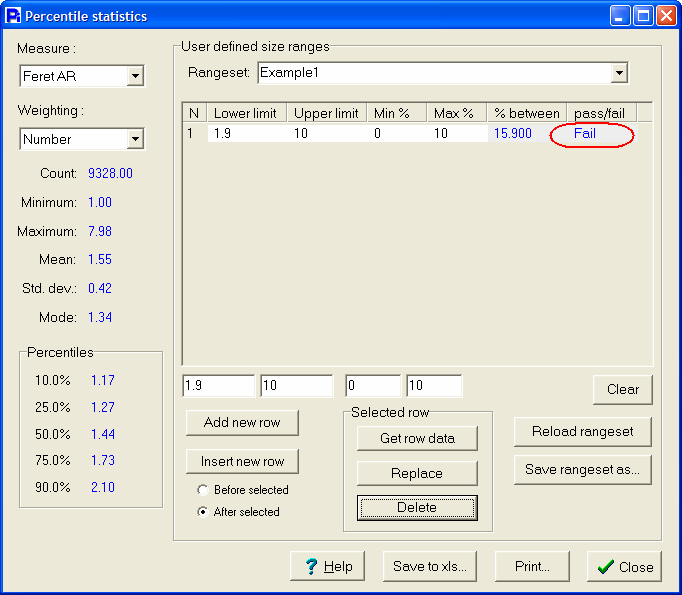
With a method established to determine that the Feret Aspect Ratio of incoming alumina packing material had no more than 10% rod-like particles, the end-user was able to create a simple process control indicator with the Particle Insight.
Using the Percentile Statistics feature, incoming quality control can determine easily and quickly if a lot of material passes or fails the criteria established by management.
Conclusions
The Particle Insight with its Dynamic Image Analysis technique can help reduce costs by finding HPLC packing material inconsistencies prior to reaching column manufacturing. The manufacturer is still responsible for determining the acceptable percentage of non-spherical particles for incoming materials. Once the manufacturer establishes incoming quality control criteria, the Particle Insight can be used as a pass/fail inspection tool to determine the percentage of spherical to non-spherical particles. Solving this potential problem early in the process improves production and helps to ensure consistent HPLC column quality and performance.
PARTICLE SHAPE APPLICATION EXAMPLE: Oil Contaminants
The challenge
Early detection of wear particles in lubricating and hydraulic fluids is critical to having a proper predictive maintenance program. It is this early detection and identification of wear particles that permits the extension of engine life and can minimize down-time of equipment. The challenge is to count the number of contaminant particles between specified size ranges, and to classify them into several types.
Applicable measures |
Measure |
Range of acceptance3 – 500 microns 0 – 1.00 0 – 1.00 2.0 – 100 microns 5.0 – 100 microns 1.0 – 50.0 |
Typical image
 |
Image showing ECAD micron sizes. Calibration is 0.62 microns/pixel. The large circles are water droplets. |
Notes
ISO 4406 Standard for Oil Cleanliness
The ISO 4406 standard was established in 1987 as a method of coding the level of particle contamination of hydraulic fluids. The most recent revision of the standard, 1999, has been changed to account for the use of a different calibration standard for optical automatic particle counters. The sizes to report now are specified as ≥ 4µm, ≥ 6µm, and ≥ 14µm. After the counts for these three sizes are determined, they are summarized in a kind of shorthand known as Scale Numbers:
ISO Code 17 / 15 / 12
The first of the 3 numbers relates to particles ≥ 4µm, and is a code indicating the approximate count: Scale Number 17 means that the count (expressed as a concentration) was between 640 particles / ml of fluid and 1300 particles / ml of fluid.
The second scale number relates to particles ≥ 6µm. In this case, the value 15 is indicative of a count between 160 particles / ml and 320 particles / ml.
The third scale number codes the amount of particles ≥ 14µm in size. A value of 12 indicates the count was between 20 and 40 particles / ml.
The ISO 4406 standard lists scale numbers that code a wide range of possible particle concentrations.
Results
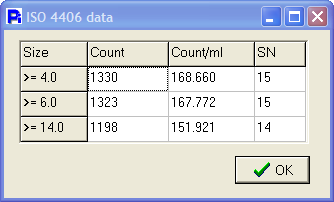 |
The three 4406 concentrations are shown in the Scale Number shorthand as 15 / 15 / 14. |
Particle Insight presentation at Reliable Plant conference

Reliable Plant 2014, the annual conference and exhibition for machinery lubrication, oil analysis and reliability professionals, was held in San Antonio Texas on April 22-24, 2014. This industry event offered extensive pre-conference workshops and learning sessions covering today’s trends, technologies and issues. One of the session workshops covered the use of image analysis for this industry. Here are links to view the presentation given. |
 |
Particle Classification results
PARTICLE SHAPE APPLICATION EXAMPLE: Abrasives
The challenge
Abrasive Powders are used in a variety of everyday applications. It can be the particles used to polish teeth, abrasive polishes to make expensive automotive finishings shine, or even the sandpaper a carpenter uses for his daily work. All of these powders are designed to remove material. Some are more aggressive in removal than others. Sometimes the abrasiveness of particles is referred to as the “grit” of the powder. As you can imagine the more aggressive the grit, the more removal of material one would expect. However, the grit of the powder is a function of not only the size of the particles but also its shape characteristics. A low grit, which corresponds to a stronger removal, has larger particles. However if these larger particles were all smooth and round, the removal performance would be poor. Because of this, both size and smoothness are important in abrasive powders.
Here we study various abrasive powders and show how these powders contrast not only in size for the different grit classifications but also how they compare in smoothness. As we will see, proving abrasive consistency cannot be done by size alone. The Smoothness of the powders is also a critical measure to control.
Applicable measures |
Measure |
Range of acceptance3 – 500 microns 0 – 1.0 |
Procedures and Results
Several abrasive powder samples were analyzed. For this report we are using three different abrasive powders, each being a different “grit.” The manufacturer of these abrasive powders currently use a size-only measurement to check the quality of their abrasive powders before sending them to their final use: polish and in most cases, sandpapers for different applications. Particle-size-only instruments will report sizes as if the particles are round, and do not report shape information. That may be acceptable for some raw materials but where the smoothness of the particles is directly associated with their performance, this is not adequate.
The Particle Insight is able to analyze thousands of particles in just a few minutes and show results of up to 30 size and shape measures. For this study, the Particle Insight was able to do detailed statistical analysis of the smoothness of these particles as well as enable the user to see any single particle that may have been out of specification.
Particle images and data


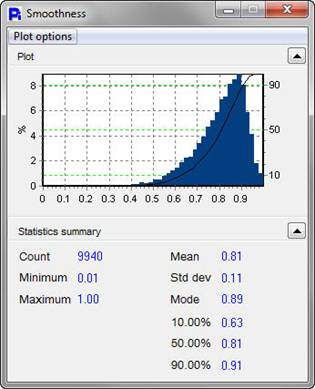
The Particle Insight allows correlating any two size/shape measures. Here we see a scatter chart of all these abrasive particles, plotted by Size and Smoothness. The correlation plot shows that size and smoothness are mostly independent of each other.


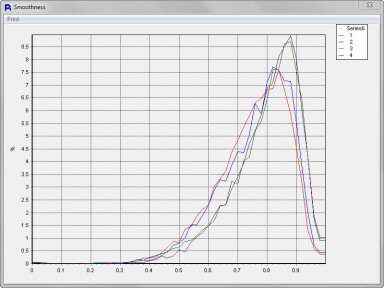
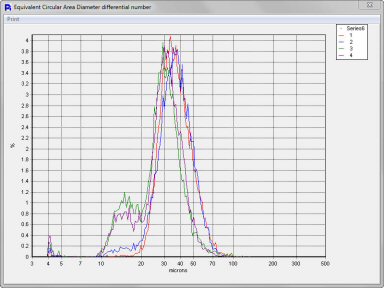


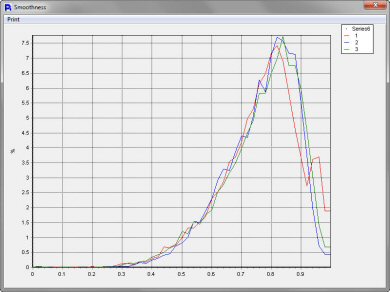
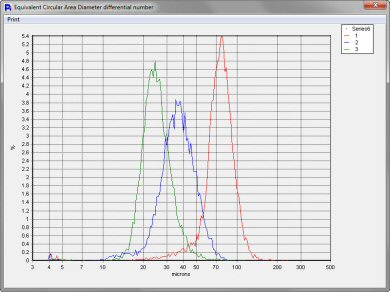
After analyzing three different grits of abrasive powders we can see that the particle size is different for all three, as we would expect. However, what we have shown here is that regardless of the size or grit of the abrasive powders, the smoothness of the powders are very uniform. This tells us that the grinding process of the manufacturer of these abrasive powders is very well under control. The consistency of the smoothness regardless of size is critical to ensure uniformity of performance of the abrasive particles regardless of their end use.
One other thing we were able to identify using the Particle Insight is that being a direct measurement technique that works on a counting or single-particle basis, if there are any large unwanted particles, we could easily identify those not only by the number based distribution and data for any single particle but also by viewing the thumbnails for each out-of-specification particle. After all, no one would want to polish their care with a product that has even one large unwanted particle.
PARTICLE SHAPE APPLICATION EXAMPLE: Diamond Abrasives
The challenge
Finely-cut diamond abrasive is used to make industrial drills, grinding wheels and discs, dental tools and lapidary equipment. Grinding tools are used to shape steels, alloys, ceramics, glass, granite and other materials. Two sizes, or grits, of abrasive were studied. Below is a typical raw image of particles from each of the two samples.
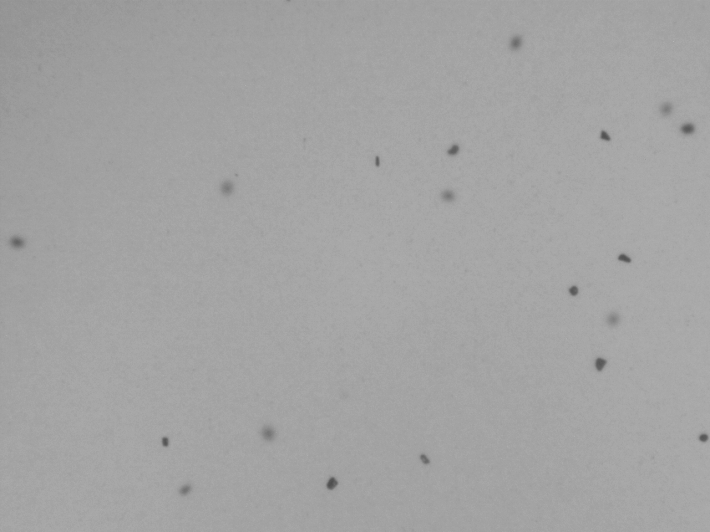

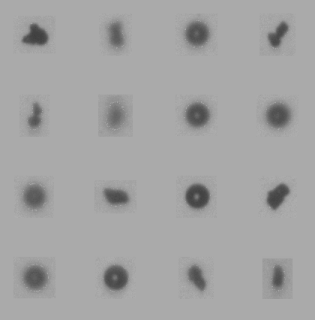
Here are two collections of particle thumbnails from the two samples:
 |
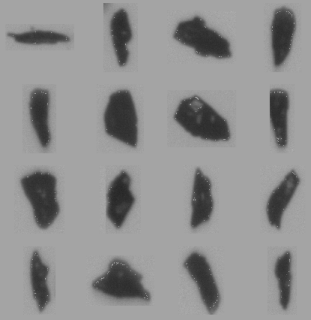 |
| The first sample contains very fine sizes. There are also a few spherical bubbles present. They are between about 30 and 40 microns in diameter. | The second sample has considerably larger grains, with straight-faceted sides. Some of the sides are convex and some are concave. |
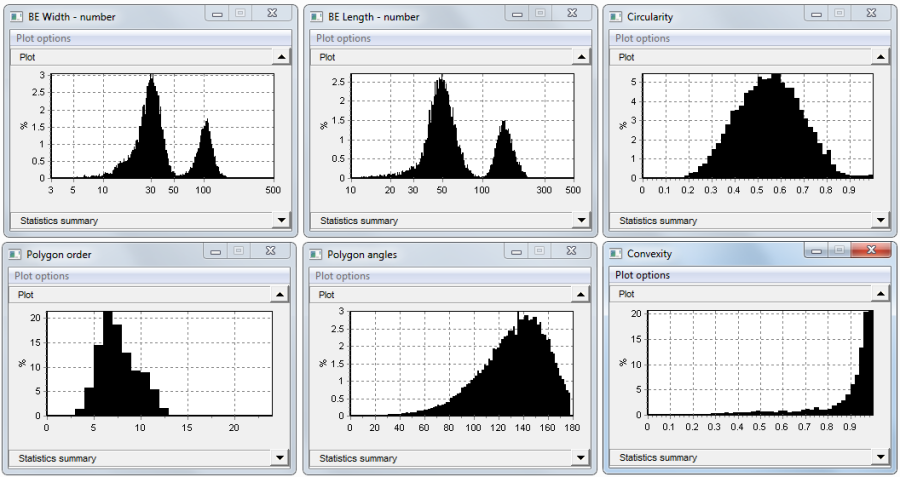
Size distribution is of primary interest; but since the abrasive grains are not round, a single size measure is inadequate. Length and width are needed. Particle shape also has a large effect on abrasive performance. A polygon shape with sharp angles performs best.
For size measurement, the elliptical model will work best. The particles are not ellipses; however a fitted ellipse can provide a good measure of width, length and aspect ratio. We will use the least bounding ellipse. For shape we use the polygon model since most particles appear polygonal with straight sides. Polygon order is the number of sides of the fitted polygon, and polygon angles are the interior angles of the polygon. Convexity tells us whether a particle has a generally convex shape, that is, how well it matches the fitted polygon. A particle with indented sides would have a lower convexity than one that fills most of the polygon.
Applicable measures |
Measure |
Range of acceptance3 – 500 microns 10 – 500 microns 0 to 1.0 0 to 25 0 to 180 0 to 1.0 0 to 1.0 |
Image analysis settings included minimum pixel area: 5; maximum pixel area: 50000; binary threshold: 80%; focus rejection parameter: 50; pump speed: 40%, and the option to correct size for diffraction effects is was enabled.
Results
Sample 1:
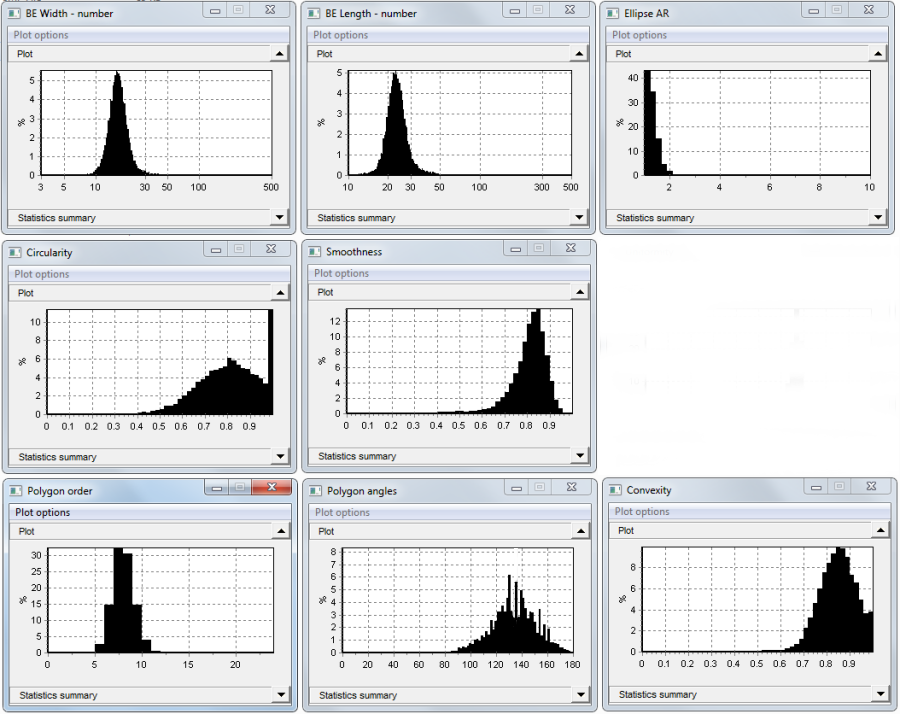
Width and length are normally distributed, approximately, with all aspect ratios below about 2. Number of sides (polygon order) is centered around 7 and 8. Interior angles center around 135 degrees. Convexity has a spread to its distribution but is fairly high. Circularity shows a spike at 1 due to the presence of the spheres.
Using the post-processing filter, it is possible to reanalyze the particles excluding the spheres, by placing an upper limit of 0.99 on Circularity.

The data does not change much, because the spheres account for less than 10% of the sample (1430 out of 15114).
Sample 2:
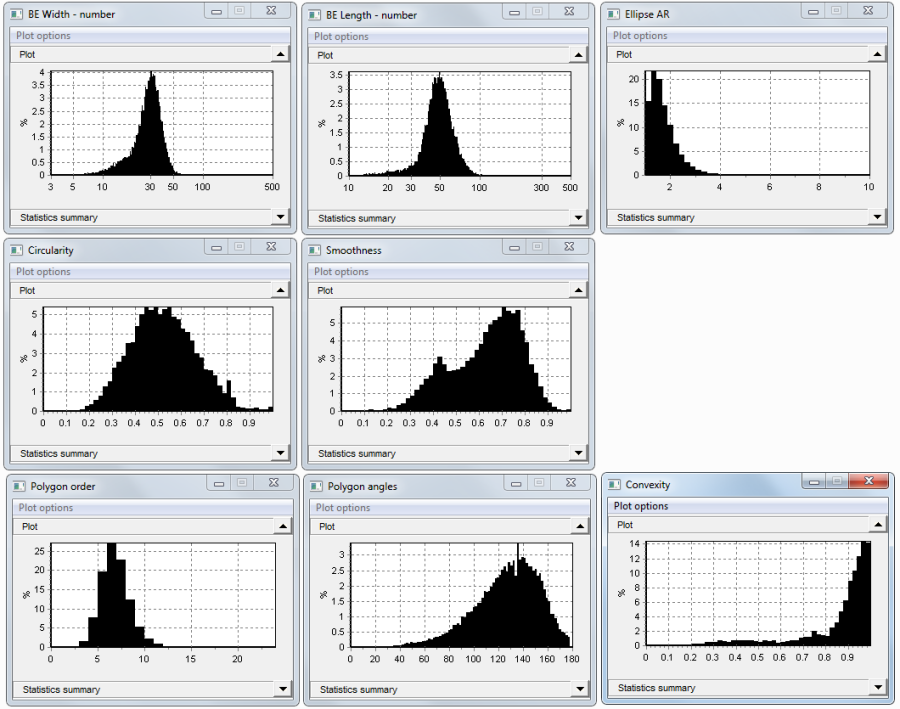
In the second sample, the Bounding Ellipse width mean increased to 28.7 microns, from 17.0 in sample 1. Bounding Ellipse length increased from 23.9 to 49.4. Both Circularity and Smoothness of these larger abrasives are lower than the fines of sample 1. Polygon Order is about the same here. Interior angles have a similar mean, but the histogram now looks like the usual kind of skewed normal distribution. Many of the particles in sample 1 are too small to compute the angles. Convexity is higher with the larger abrasives.
A third sample was mixed from samples 1 and 2, for demonstration purposes. The analysis of that mixture shows the presence of the two original materials, in unequal amounts. It would be possible to separate out the two parts using one of the Particle Insight separation methods, and compare the results to the original samples.
PARTICLE SHAPE APPLICATION EXAMPLE: Pollen
The challenge
There are many different varieties of pollen within various species. Several varieties of pollen were analyzed using Dynamic Image Analysis to test if their morphology (shape characteristics) could be used as a differentiator among the various types, and to differentiate between whole pollen grains and pieces or debris. Size-only methods often cannot make this distinction.
| Applicable measures |
Measure |
Range of acceptance1 – 500 microns 0 to 1.0 0 to 1.0 0 to 1.0 |
Procedures and Results
A total of six different varieties of pollen samples were studied: Alder, Short Ragweed, Pecan, Redtop, Timothy Grass, and Paper Mulberry.
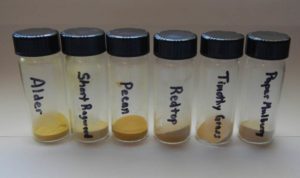
All samples were prepared by suspending them in water and dispersed prior to analysis. Particle size-only instruments will report results assuming all particles are round or spherical in shape. That may be acceptable for some samples that are uniformly-shaped, but where shape differences exist this technique is not adequate. It will be shown that shape, not only size, is a better tool to differentiate between various types of pollen.
The Particle Insight was able to analyze thousands of particles in just a few minutes and show results of up to 30 size and shape measures. The Particle Insight was also able to perform detailed statistical analysis of the shape of these pollen particles as well differentiate them based on these shape statistics.
Timothy Grass Pollen


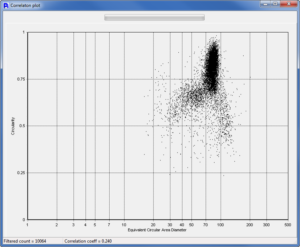
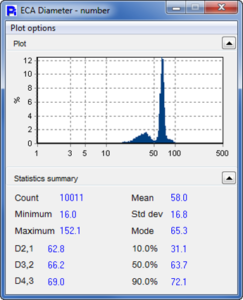
The Timothy Grass Pollen showed a unimodal size but with broad Circularity. Thumbnail images offer confirmation that there are some round particles that are uniform but there are also some particles that may be debris or parts of broken pollen particles. The Correlation Plot allows the user to compare any two measures. In this case, Circularity Vs. Size was plotted to get additional characteristics of the outlying particles.
full report
Red Top Pollen

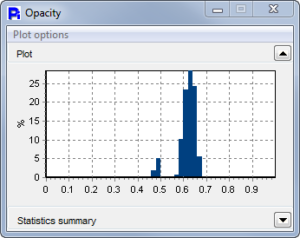
 Red Top Pollen grains are dark but with varying Opacity values. There were also debris particles and portions of broken pollen present.
Opacity is a very useful tool. It is a measure of the particle’s intensity mean calculated as a fraction between 0 and 1: 0 is fully transparent and 1 is fully opaque (black). The Opacity for the Red Top Pollen shows a clear bi-modal distribution. The Particle Insight is capable of showing and sorting the particles by any measure including Opacity.


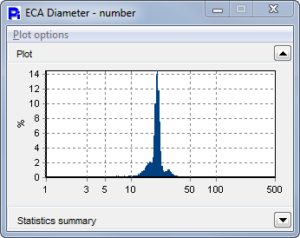
The debris particles, besides being shown in the thumbnail images, are statistically shown here as the smaller sized particle group in the ECA Diameter distribution. A correlation plot would show that these correspond to the particles with low Smoothness.
Paper Mulberry Pollen
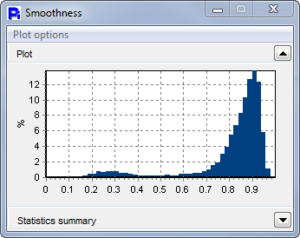
Paper Mulberry Pollen has a very uniform size and Opacity as can be seen from the statistical histograms. The Smoothness graph shows a bimodal distribution, indicating two classes of pollen grains. As can be seen by the thumbnails, the less-smooth particles seem to be full pollen particles but of a different shape.


Pecan Pollen

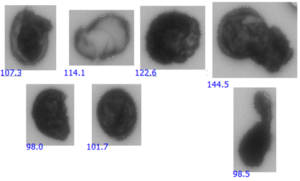
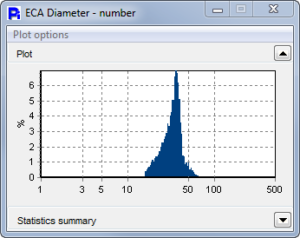
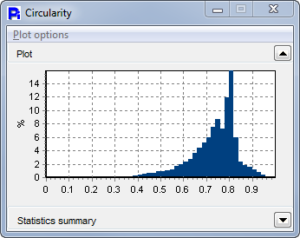
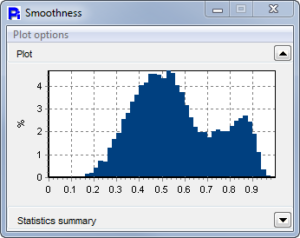
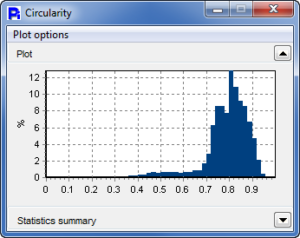
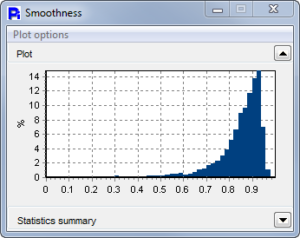
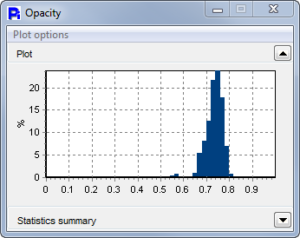
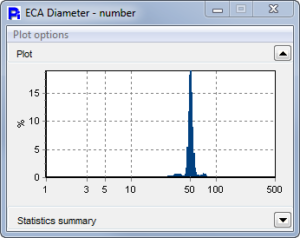
Pecan Pollen is an excellent example where we can show that size data is not everything. The ECA Diameter shows these particles to be very unimodal, and we might assume they are all round. However, once the Circularity, Smoothnes and Opacity is reported, we can now see that there are a very wide variety of particle shapes.

Short Ragweed Pollen
Short Ragween Pollen has a very uniform Size, Circularity, and Opacity.


Alder Pollen


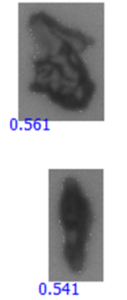
Alder Pollen data shows that a major portion of the particles have low Smoothness. As was shown by the thumbnails, this was caused by some debris that was not similar to the pollen. This information may be useful in improving the collection process of the pollen.


Customizable Statistical Reports

Keeping in mind that the Particle Insight performs high speed analysis of particles in real time, every particle measured not only has a saved thumbnail image but also has each shape measure determination saved, as well as the frame number it was found in. All this data can be reported in numerous ways besides the statistical histograms we have shown. Excel spreadsheets can also be created for individual samples or as comparisons, as shown above.
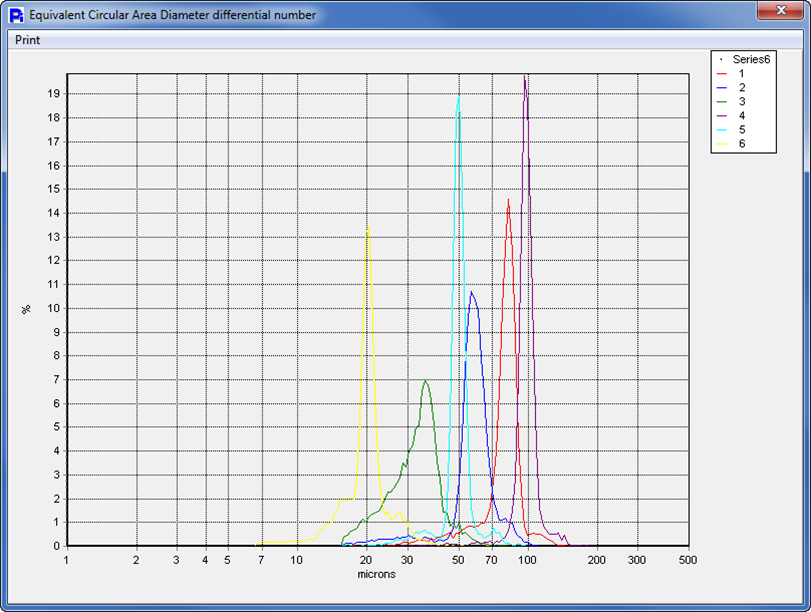
By doing an overlay of all the pollen samples and comparing not only their size, but also their shape, we can do an in-depth comparison of how these pollens compare and differ.
Here we can see that for the most part, all samples are rather uniform in particle size. But we have seen that they are not uniform in shape. This fact can be useful to develop a fingerprint for each pollen sample and detect just how much cross pollen species are in any specific sample. The Particle Insight has a unique feature called Particle Classification that can simplify this operation.
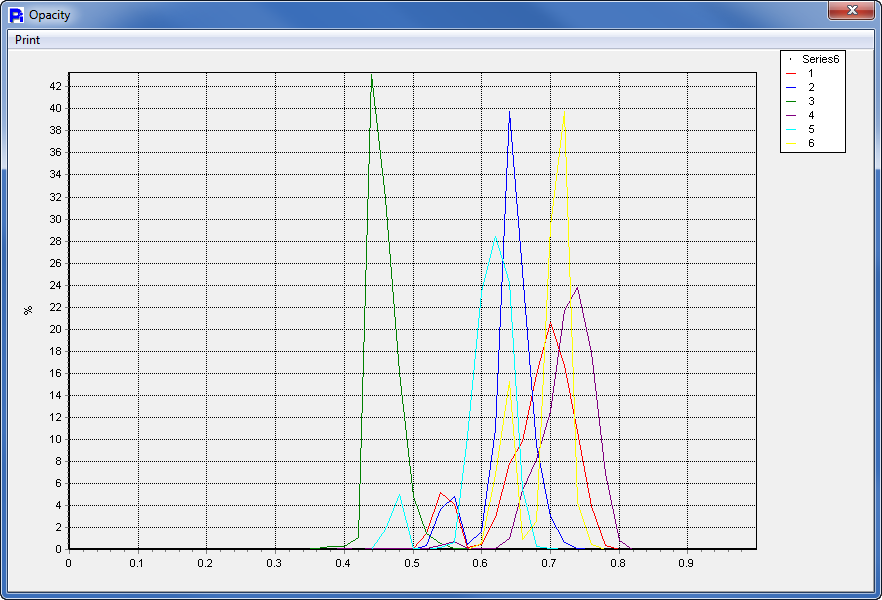
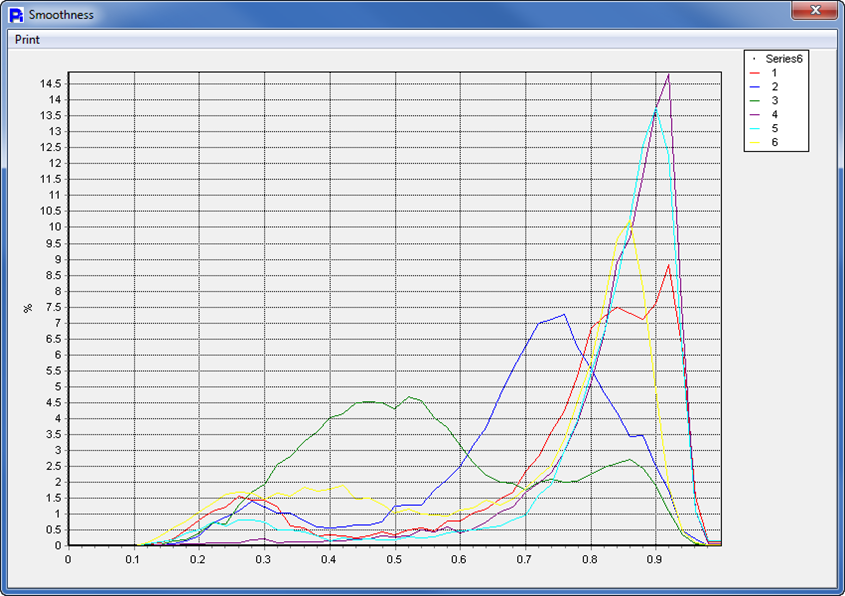

Here we can see that by comparison, the Opacity and the Smoothness of all the pollen samples are slightly different. However the Paper Mulberry pollen is dramatically different in Opacity as well as Smoothness (green line in overlay graphs).

Even though the Paper Mulberry Pollen was drastically different in Smoothness and Opacity, here we see that with Circularity, the outlying pollen samples are the Red Top and the Alder Pollen.
Conclusions
After analyzing six different pollen samples, we can clearly see the differences in the species not only by size but more so by alternative shape measures such as Circularity, Smoothness, and Opacity. In addition to being able to differentiate between species, we were also able to show how within each pollen sample, there could be dual populations of Opacity and even Circularity. The Particle Insight shows the ability to not only determine up to 30 size and shape analysis measures for each particle measured, but is also able to determine concentration and report data in a wide variety of ways.
PARTICLE SHAPE APPLICATION EXAMPLE: Portland Cement
The challenge
Portland cement is a controlled chemical combination of calcium, silicon, aluminum, iron and small amounts of other ingredients to which gypsum is added in the final grinding process to regulate the setting time. Lime and silica make up about 85% of the mass. Common among the materials used in its manufacture are limestone, shells, chalk combined with shale, clay, slate or blast furnace slag, silica sand, and iron ore.
The strength and setting time of cement is determined by how efficient the chemical reactions between the components are. This in turn is strongly impacted by the particle shapes of the various materials. Predicting the behavior of the end product requires a detailed knowledge of the particle shape makeup.
Traditional non-imaging size analysis instrumentation will report sizes assuming that all particles are round or spherical. Data of that kind may misrepresent the way they will flow in production or perform in their final use.
 Typical Size-only result from a commonly used size analyzer Typical Size-only result from a commonly used size analyzer |
 |
This particle represented as “round” would report as “100.1 μm in diameter”. |
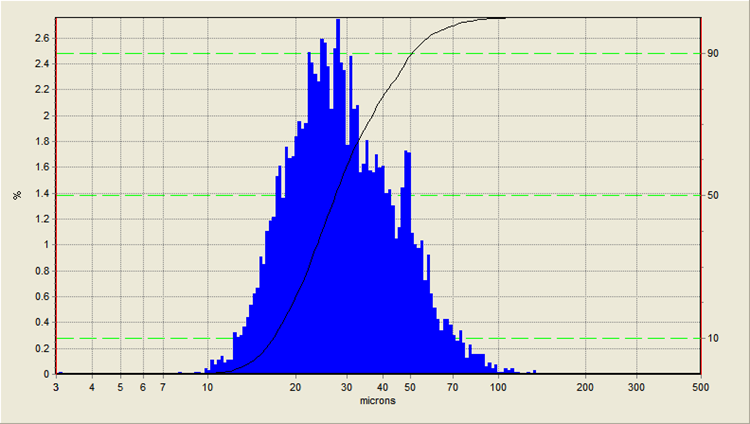 Here we see a typical “diameter” histogram reporting a smooth size distribution centered at about 30µm. Here we see a typical “diameter” histogram reporting a smooth size distribution centered at about 30µm. |
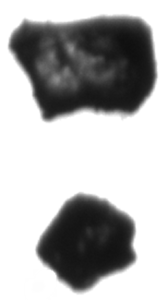
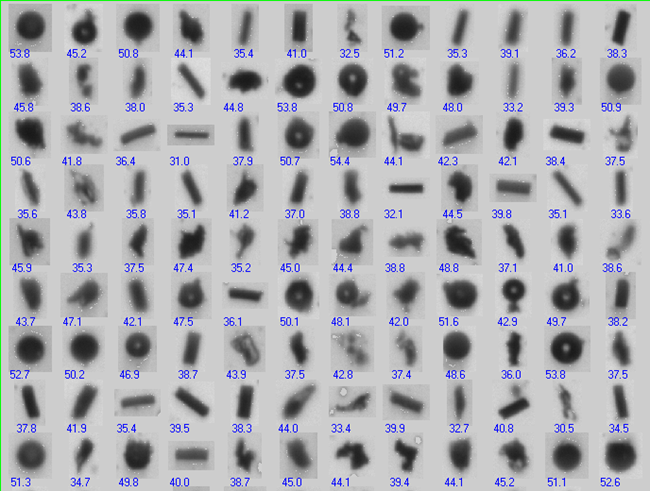 In looking at a sampling of the particle thumbnails, it is obvious that this sample is made up of more than one kind of particle shape. The “diameter” data may mislead the user into thinking the particles are all the same type when they are not. In looking at a sampling of the particle thumbnails, it is obvious that this sample is made up of more than one kind of particle shape. The “diameter” data may mislead the user into thinking the particles are all the same type when they are not. |
The sample contains several types of particle shapes, probably corresponding to the different materials in the mix. The task is to use the power of imaging to characterize the particle subpopulations, in terms of size and shape.
Applicable measures |
Measure |
Range of acceptance3 – 3000 microns 0 to 1.0 0 to 1.0 3 – 1000 microns 10 – 3000 microns 1 – 10.0 0 to 1.0 |
Procedures and Results
The Particle Insight data below shows some of the size and shape results for the Cement sample. These are overall results for the entire sample. 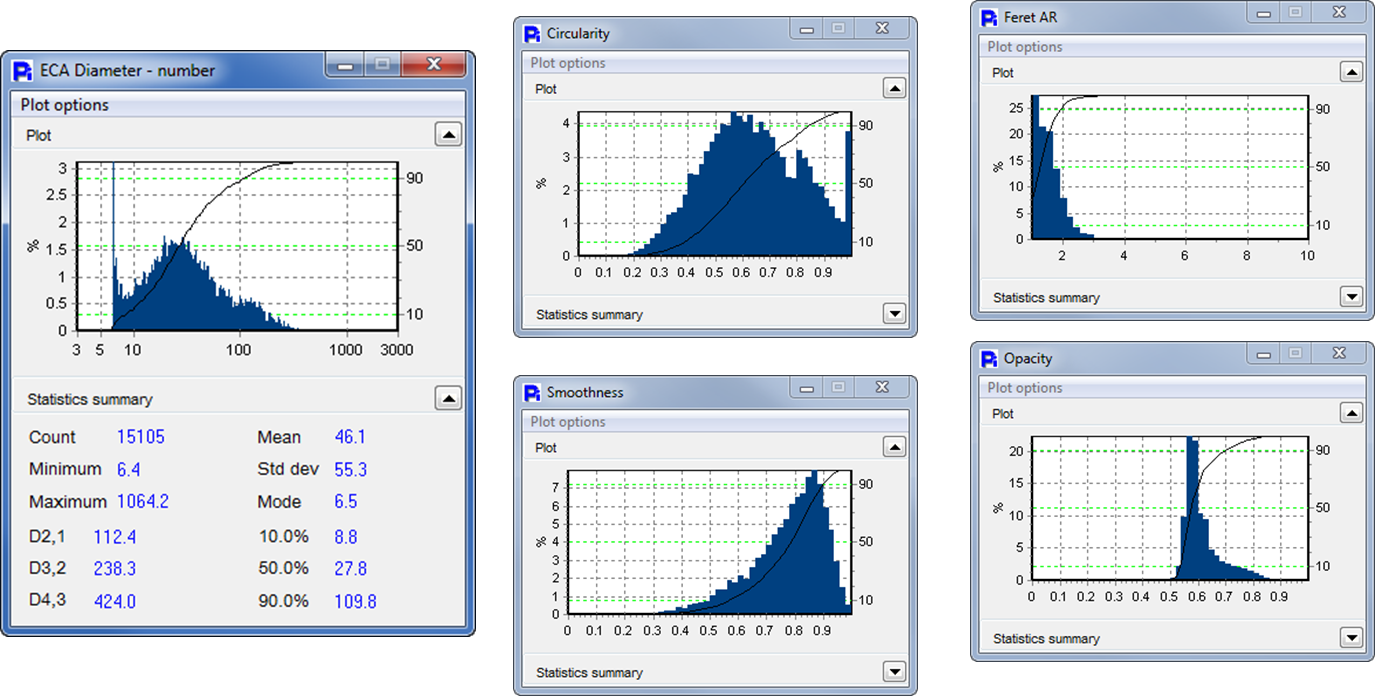
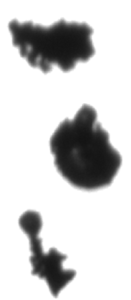
To demonstrate how to use Smoothness to separate out subgroups, let us for simplicity divide the entire sample into a “smooth” classification and a “rough” classification. Looking at the thumbnail particle images, this distinction makes sense; the two subroups are evident. The Smoothness measure should be able to easily separate out these subgroups. In the screenshots below, 0.84 is used as the Smoothness dividing line. The Comprehensive Statistics form displays commonly used means and measures of spread.
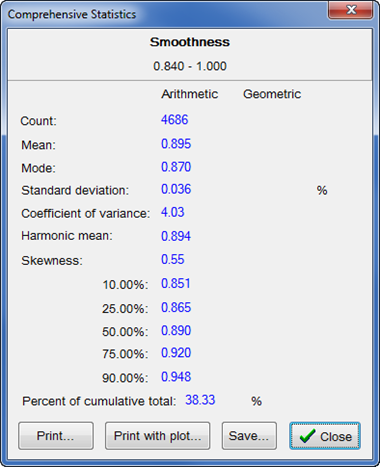 Based on a Smoothness greater than 0.84, the smoother particles represented 38.33% of the entire sample. Based on a Smoothness greater than 0.84, the smoother particles represented 38.33% of the entire sample. |
 |
 |
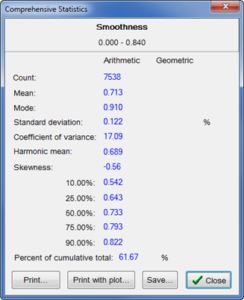 The irregular particles having a Smoothness below 0.84 represented 61.67% of the entire sample. The irregular particles having a Smoothness below 0.84 represented 61.67% of the entire sample. |
In addition to the statistics summary show here, the Particle Insight post-processing utility lets you present the full distribution of any or all of the measures used, for each particle subgroup. You can also view particle thumbnails and 2-measure correlation diagrams.
To analyze only the “very smooth” subgroup, we can place a lower limit of 0.89 on Smoothness in the post-run processing utility.

To analyze only the “very rough” subgroup, a lower limit of 0.60 on Smoothness can be used:

We can also view a correlation of particle smoothness with generalized size. The scatter plot shows that in general smoothness correlates inversely with size – the smoothest objects are the smallest ones.
The Particle Insight post-processing can correlate any two size or shape measures with each other.

Conclusions
To analyze the cement sample in more detail we could separate out three or more particle groups based on size and shape in the post-run processing. For example the almost-round group has high circularity and smoothness with low aspect ratio. That group could be isolated by placing an upper or lower limit, or both, on those three measures in the “Filter Criteria” window. The “stick-like” objects would have low circularity with medium smoothness. The highly irregular shapes would be isolated using the smoothness measure. Further refinements could be made by filtering on most or all of the measures used.
PARTICLE SHAPE APPLICATION EXAMPLE: Toner powder
The challenge
Toner powder for laser printers and photocopiers is a mix of carbon and a polymer. The specific polymer used varies by manufacturer. Toner formulations vary from manufacturer to manufacturer and even from machine to machine. Granule size is an important property that distinguishes the different formulations.
According to Wikipedia, “Originally, the particle size of toners averaged 14–16 micrometers or greater. To improve image resolution, particle size was reduced, eventually reaching about 8–10 micrometers for 600 dots per inch resolution. Toner manufacturers maintain a quality control standard for particle size distribution in order to produce a powder suitable for use in their printers.”
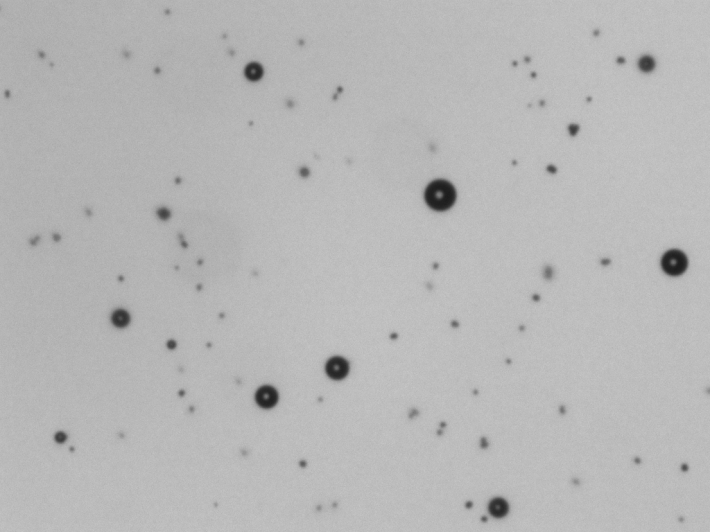
Toner grains are small and very close to spherical. There are also a few larger beads present. Because we can legitimately assume sphericity for everything, it is sufficient to use Equivalent Circular Area as the primary size measure, along with Circularity and Smoothness to provide additional characterization.
Applicable measures |
Measure |
Range of acceptance2 – 500 microns 0 to 1.0 0 to 1.0 |
Image analysis settings included minimum pixel area: 5; maximum pixel area: 50000; binary threshold: 80%; focus rejection parameter: 50; pump speed: 40%, and the option to correct size for diffraction effects was enabled.
Results
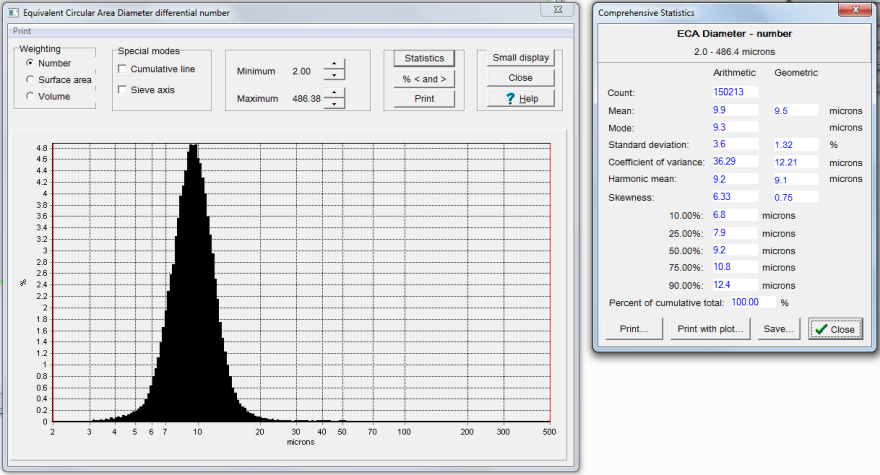
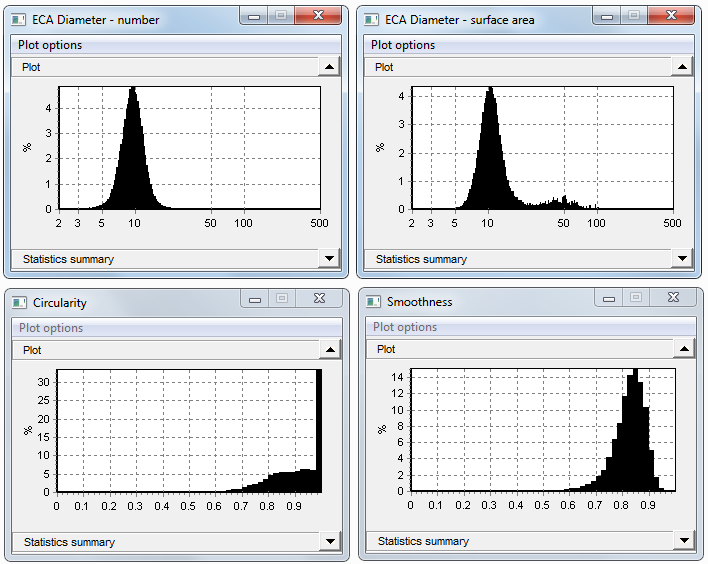
A particle count of 150,000 produces very smooth distribution graphs. The ECA histogram is seen to be close to normal, with low skewness. the smallest size measured was 2 microns and the center is about 10 microns.
Below are seen the “small data window” plots for ECA (number and surface area), Circularity, and Smoothness. The large beads are too few in number compared to the toner grains to show up in the unweighted distribution, but they can be seen in the surface area-weighted plot because they contribute a noticeable amount to the total surface area. The spike in Circularity at 1 reflects the large beads and most of the small grains.
PARTICLE SHAPE APPLICATION EXAMPLE: Ocean Sediments
The challenge
Ocean floor sediments are studied by marine scientists. They are composed of fine particles of sand, clay, volcanic ash, minerals and organics. The small grain size makes measurement a challenge. Two different kinds of sediment were studied for this example.
Applicable measures |
Measure |
Range of acceptance3 – 500 microns 3 – 500 microns 10 – 500 microns 1 to 30 0 to 1.0 0 to 1.0 |
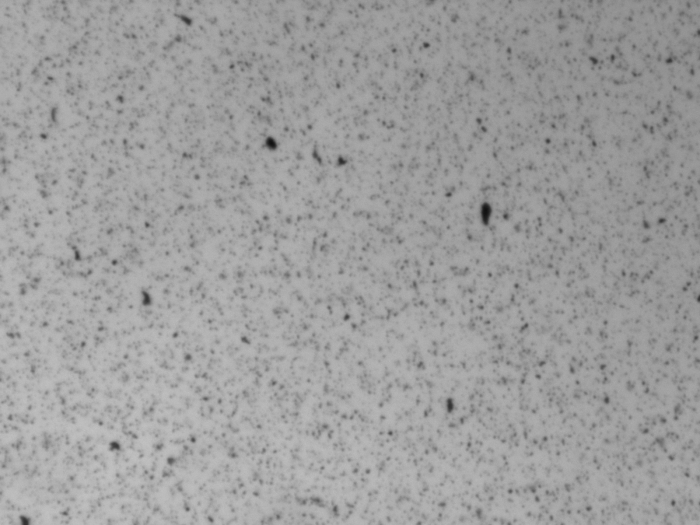
The first sample is made up of very fine grains below 50 microns in size. This is more like a silt than sand grains. A typical image has a high concentration of tiny particles:
A sample of thumbnails looks like:

With a particle concentration this high, clusters of particles are sometimes counted as a single unit. The faint thumbnails seen here are such clusters. They can be bypassed in a reanalysis of the sample.
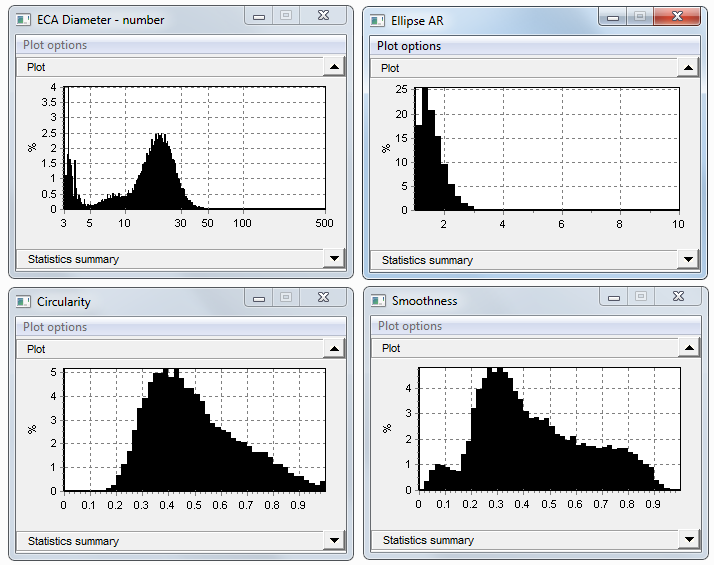
The Circle shape model is best for such small sizes. Just three measures are sufficient for this first sample: ECA diameter, Circularity and Smoothness. We add Ellipse Aspect Ratio to see if there are non-spherical objects present. The unfiltered results of this sample show an uneven distribution of sizes below 50 microns:
To bypass clusters, reanalyze the sample with these constraints: circularity greater than 0.35, smoothness greater than 0.4, and rectangularity greater than 0.65. With that filter, a sample of thumbnails has this appearance:
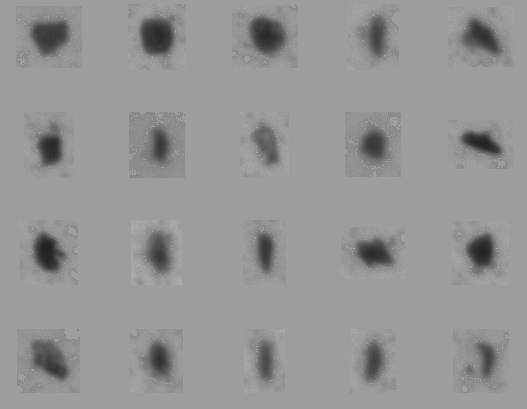
The filtered reanalysis gives a size distribution that is mostly between 10 and 50 microns. Circularity and smoothness are considerably higher now.

The second sample has slightly larger and better-defined particles. This is a typical image:
Particle thumbnails show crystalline grains with an aspect ratio of about 2:1.

Fitting ellipses to these grains gives a good measure of length and width (numbers shown are EEA length).

Filtering is not needed for this sample. The size and shape analysis results are below. Particle lengths are between 10 and 200 microns. Circularity is centered around 0.6, reflecting the non-spherical shapes.


