In the world of fuel and lubricant analysis, traditional particle counters have long been the standard for detecting contamination. These instruments measure particle size and concentration, providing data that aligns with established contamination codes. However, a significant limitation exists: they cannot distinguish between different types of particles. Whether it’s air bubbles, wear debris, or water droplets, all are recorded uniformly, leaving analysts to make educated guesses about the nature of the contamination.
The Importance of Particle Identification in Fuel and Lubrication
Accurately identifying the type of particles present in fuels and lubricants is crucial for effective machinery maintenance and operation. For instance:
-
Air Bubbles: These can often be disregarded, as they may not indicate a serious issue. However, traditional counters treat these as real particles.
-
Water Droplets: Their presence can signal potential system failures, necessitating immediate attention to prevent corrosion or other damage.
-
Wear Debris: Identifying specific wear particles can help pinpoint the source of mechanical issues, allowing for targeted interventions.
Without the ability to differentiate among these particles, traditional counters may lead to either unnecessary maintenance or overlooked problems.
See our other Blog page on this topic
Advancements with Dynamic Imaging
Enter Dynamic Imaging—a cutting-edge technique that transcends the capabilities of conventional particle counters. This image-based method not only counts particles and determines their concentration but also analyzes each particle using over 32 measurements. This comprehensive analysis enables precise identification and classification of particles as small as 1 micron in diameter.
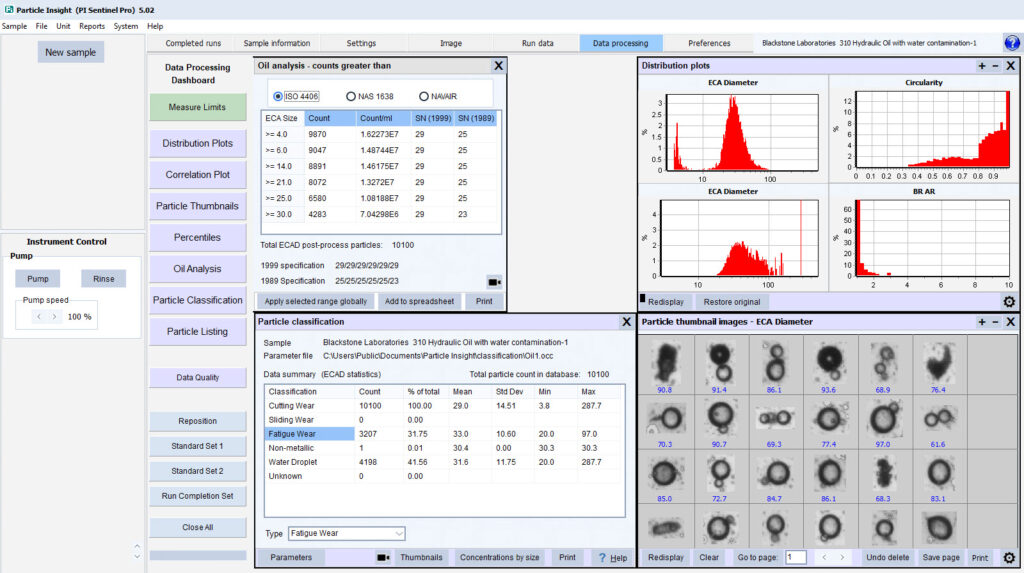
As shown above, Dynamic Imaging can report on one dashboard all the information needed for an analyst to take proper corrective action based on the types of particles found. In the case above, a customer was analyzing hydraulic fluid that had water droplets due to a failure in machinery. No expert needed to identify the problem and take immediate and accurate corrective action.
Comprehensive Reporting for Informed Decisions
Dynamic Imaging systems offer intuitive dashboards that present all necessary information for analysts to make informed decisions:
-
Visual Evidence: High-resolution thumbnails of each particle allow for immediate visual assessment, facilitating quick identification of contaminants.
-
Customizable Classification: Leveraging standards like the Noria Wear Particle Atlas, these systems can classify particles into categories such as cutting wear, fatigue wear, and non-metallic contaminants.
-
Correlation Plots: Scatter plots depicting various particle parameters (e.g., circularity, opacity) provide deeper insights into the nature and potential sources of contamination.
Real-World Application: Identifying Water Contamination
Consider a scenario where an analyst examines hydraulic fluid and discovers water droplets due to machinery failure. With Dynamic Imaging, the presence of these droplets is immediately evident, enabling swift corrective action without the need for further expert analysis.
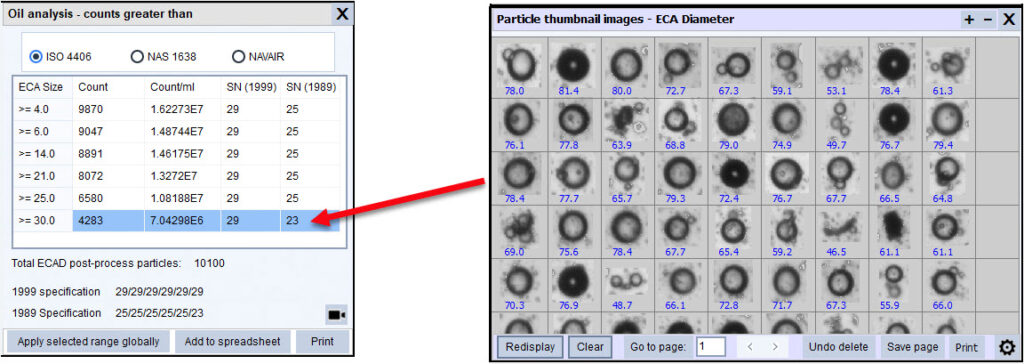
Besides showing the traditional classification reports for the different standards, users can select any reported size class and view the particle thumbnails for that class for particles greater than 1 micron in size. This objective evidence shows a significant presence of water droplets, debris, and air bubbles. The analyst can ignore the air bubbles post-analysis or pre-analysis if they desire.

For more in-depth investigation, the analyst can use classification functions that, although customizable for their specific use, come set for classification created using the Noria Wear Particle Atlas. Again, Dynamic Imaging systems are capable of displaying the particles in each class.

Particle Correlation Plots are also available with Dynamic Imaging, allowing the user to view a scatter-plot of all the measured particles. As can be seen by this correlation plot, there are many particles. This tool allows the user to spot any outlier particle in their sample easily. No expert required. This can be done at the site of inspection. No need to send the sample back to the lab when you have the lab in your hand.
One can assume what they are by looking at parameters such as circularity or opacity. Still, the best way to be sure is to view the thumbnails of any of the measured particles greater than 1 micron as objective evidence of what the particle is.
Take Control of Your Fluid Analysis
Embracing Dynamic Imaging technology revolutionizes how we approach fuel and lubricant particle analysis. By providing detailed, actionable data, it empowers analysts to maintain machinery more effectively, reduce downtime, and optimize performance.
To get a better understanding of how Dynamic Imaging has evolved into a critical tool for industry, please see this recent interview The Importance of Particle Shape Characterization (azom.com)
For more information on Dynamic Imaging for the Machinery Lubrication and Fuel market, please visit our website and contact us.
Visit our Fuel and Lubrication page…. Fule and Lubrication with Dynamic Imaging.
Ready to Elevate Your Particle Analysis?
Discover how our advanced Dynamic Imaging solutions can transform your approach to fuel and lubricant analysis. Contact us today to learn more and schedule a demonstration.


