
Dynamic Image Analysis in Fuel & Lubrication: Bridging ISO 11171 and ISO 21018-1
Can image-based particle analysis match the gold standard? Yes—and go further.
The Industry Shift: From Light Obscuration to Image-Based Insight
For years, Automated Particle Counters (APCs) calibrated with Medium Test Dust (MTD) have set the benchmark for fuel and lubrication cleanliness testing. This calibration method, rooted in ISO 11171, provides reliable particle counts but lacks visual verification and shape classification. Until recently, the field had no standardized path for alternative technologies.
Enter ISO 21018-1, a new standard designed to embrace emerging techniques that do not conform to national calibration protocols—particularly relevant for systems that analyze particle shape, morphology, and source identification.
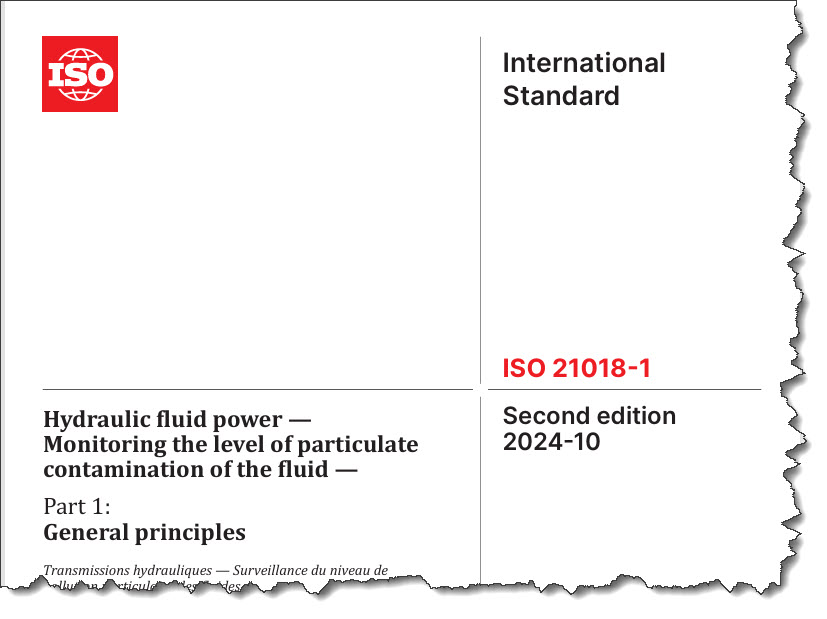
ISO 21018-1 Hydraulic Fluid Particulate Contamination
What Makes the Raptor Different
The Raptor Dynamic Image Analysis (DIA) system isn’t just compliant with ISO 21018-1—it’s compliments ISO 11171-calibrated APCs. Using MTD suspended in hydraulic fluid, Raptor delivers comparable particle counts, with the added advantage of high-resolution thumbnail images and shape-based classification.
This means you don’t just know how many particles are in your system—you understand what they are and where they may have come from.
Testing Protocol: Raptor vs. APCs
- APC – Beckman Coulter PODS system was used as the APC (Automated Particle Counter.
- Vision Analytical Raptor system with a 200micron width sample cell was used as the PCM (Particle Contamination Monitor)
- A calibration standard was made using the ISO 11171 as a guideline.
-
- Typical ISO 11171 calibration standards is made using MTD (Medium Test Dust ISO12103-1, A3 Medium Test Dust – obtained from Powder Technology Inc)
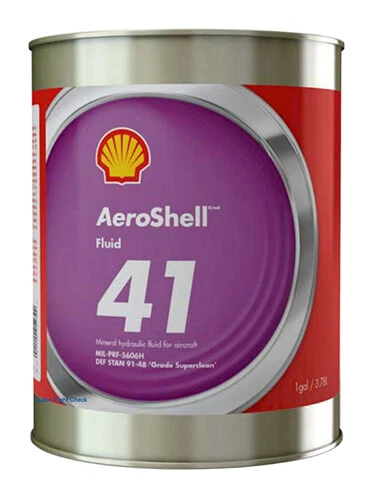
- MTD was suspended in aircraft grade hydraulic fluid
- Typical loading as required is 2.8mg/ml, however, loading was made for this test at 10mg/ml.

- The freshly made calibration material was dispersed well, shaken and run on the Beckman HIAC PODS system. Approximately 100ml were suspended in a clean sample bottle for the APC test.
- An aliquot of 5ml was then drawn into a sterile syringe. The Raptor system has the flexibility of having numerous ways to suspend a sample. In this case, in order to eliminate any outside contamination, a sterile syringe was used to draw in the same sample analyzed with the APC and a new sample cell was used. A second sterile syringe was used to capture the analyzed sample. This allowed us to run the sample more than once and eliminate the possibility of any contamination.
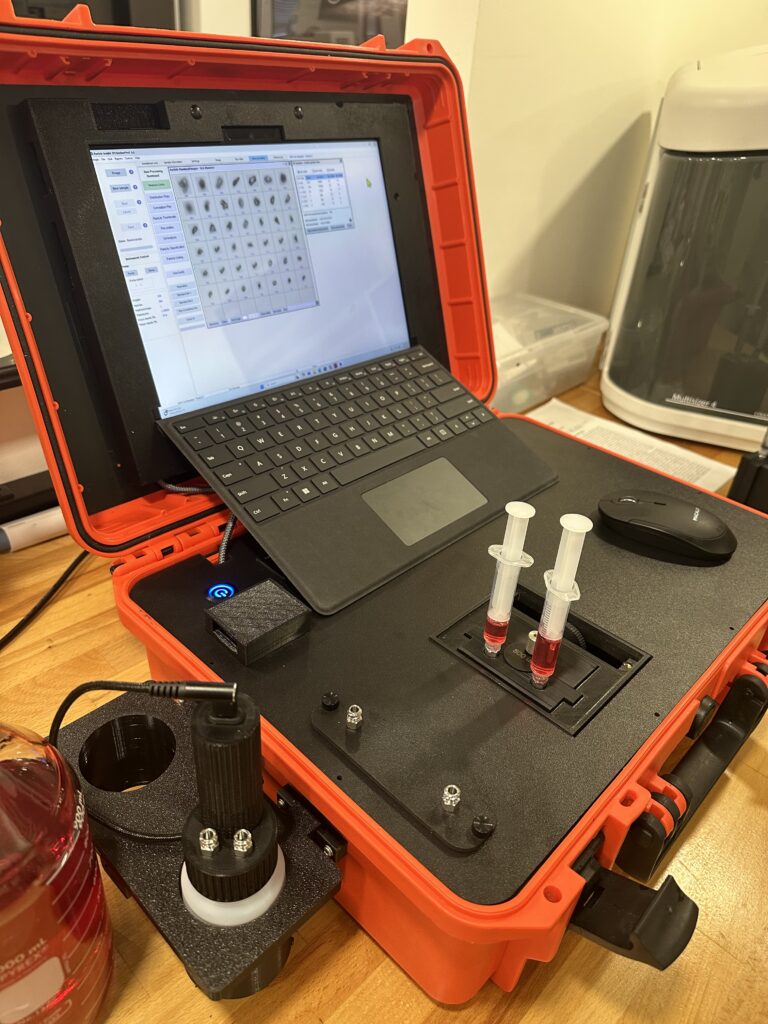
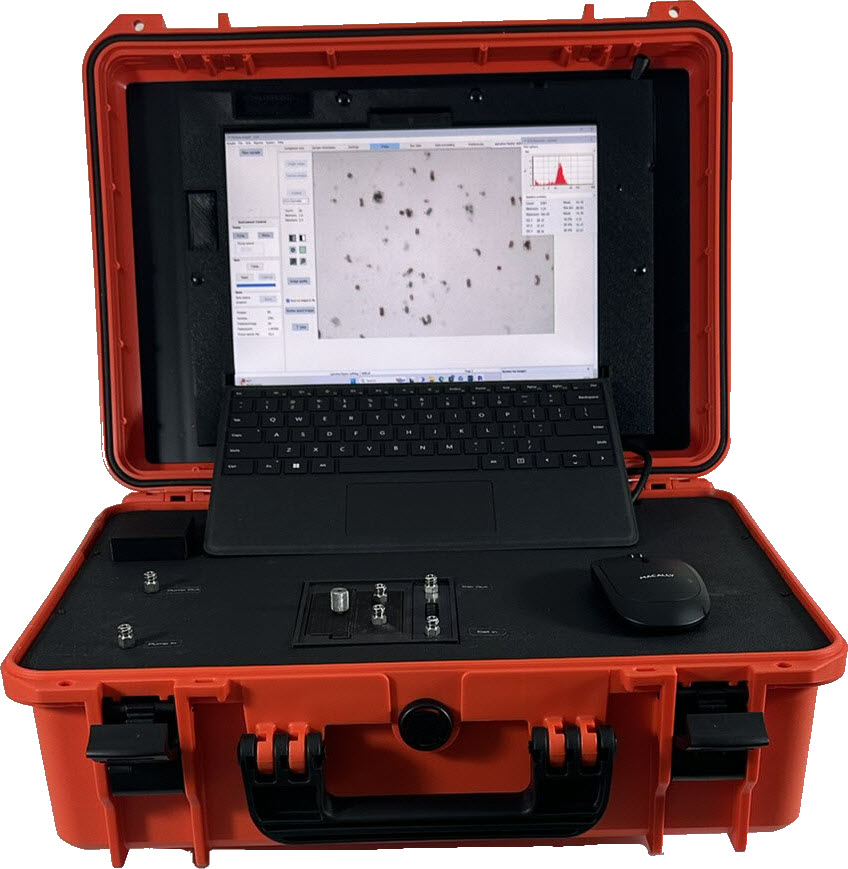
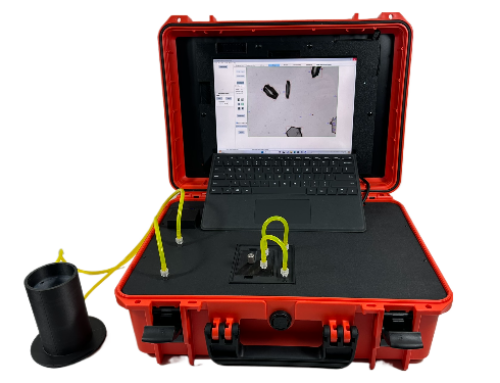
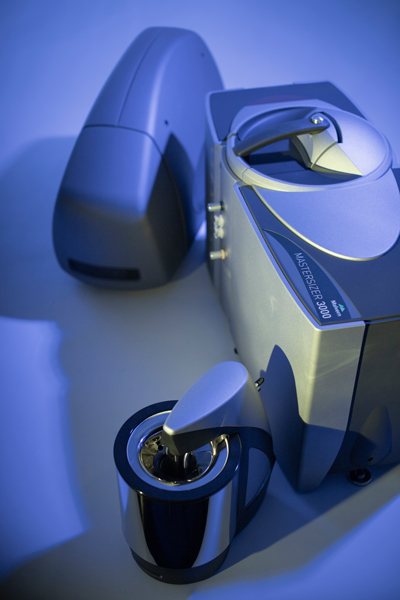
- Raptor Particle Contamination Monitoring System
- As can be seen from the picture above, the Raptor has the capability of running typical bottles used in sampling for fuel and lubrication industries. It also has the ability to run samples as a single-pass or recirculate using the same sampling bottle and a self-contained stirring system to ensure proper sample suspension.
- In addition, the use of syringes is a nice option because they serve as sample collection devices and by running samples using the syringe option, a user can keep their original sample without worrying about any external contamination. Because of this, it was the best suspension option for running the MTD calibration fluid.
Test Results: Raptor vs. APCs
In a recent benchmark comparison:
- Raptor analyzed Medium Test Dust in hydraulic fluid, achieving results in close agreement with traditional APC systems.
- Thumbnail images captured by the Raptor provided visual confirmation of particle integrity, useful for distinguishing between soft contaminants, metallic wear particles, and fiber-based intrusion.
- Shape descriptors enabled early detection of irregular or failure-prone particles, empowering preventative maintenance decisions.

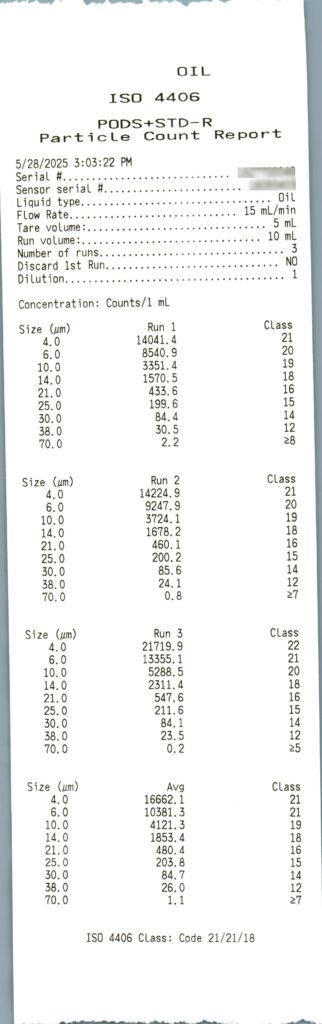
HIAC PODS+ Portable Industrial Particle Counter
As can be seen from the HIAC PODS + data above, the 3rd run was very high compared to the other runs. Therefore, it was eliminated from the average. The Resulting average was as follows.
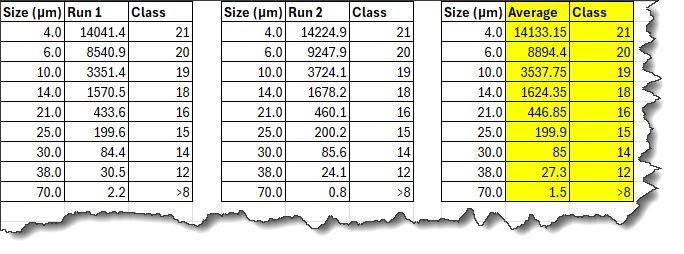
The Raptor system reports are as follows
Raptor vs HIAC PODS+
To show the results side-by side…….
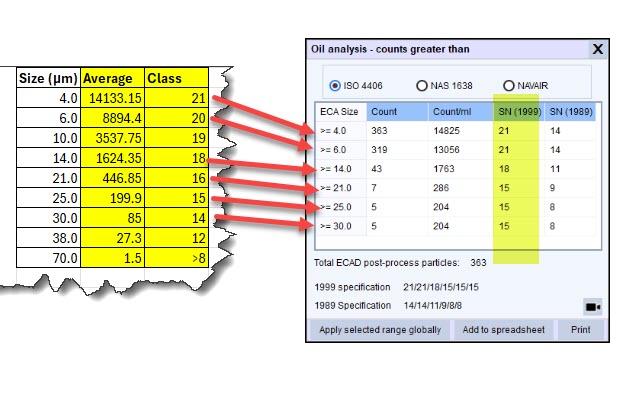
Comparisons and observations
As can be seen, there are some slight differences but there is very good correlation. Total concentration of about 14K particles per ml were very close and many of the other size classes are also very close.
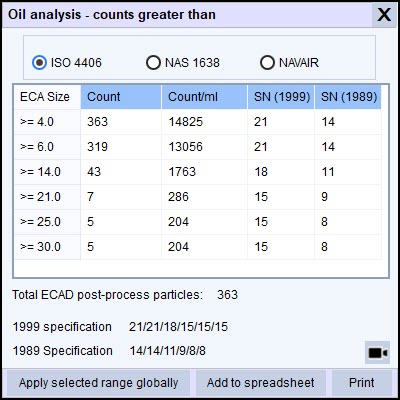
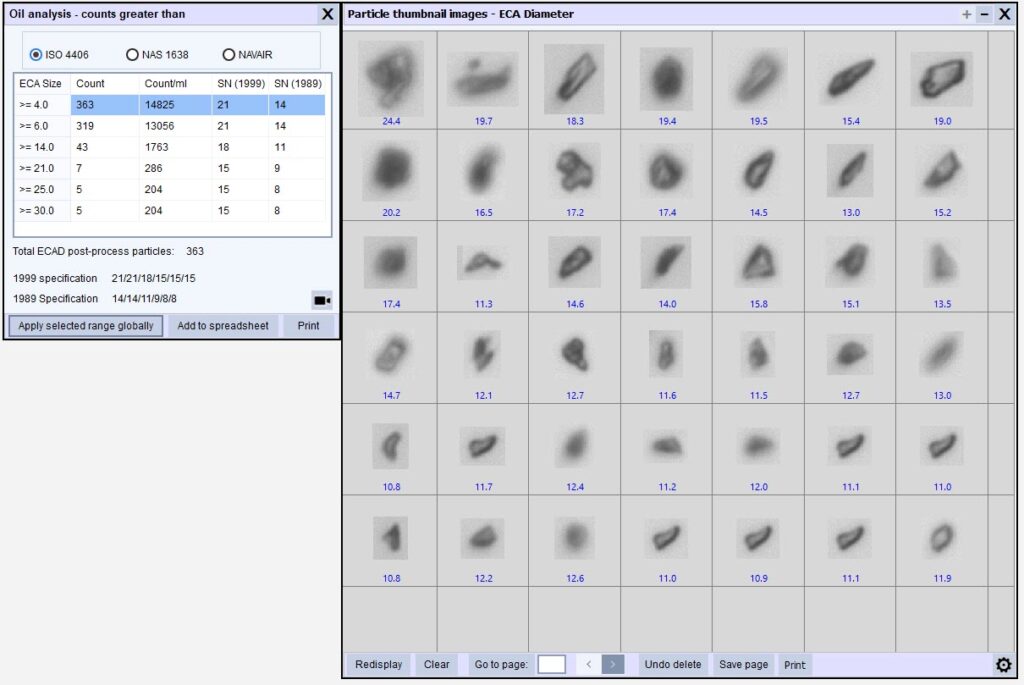
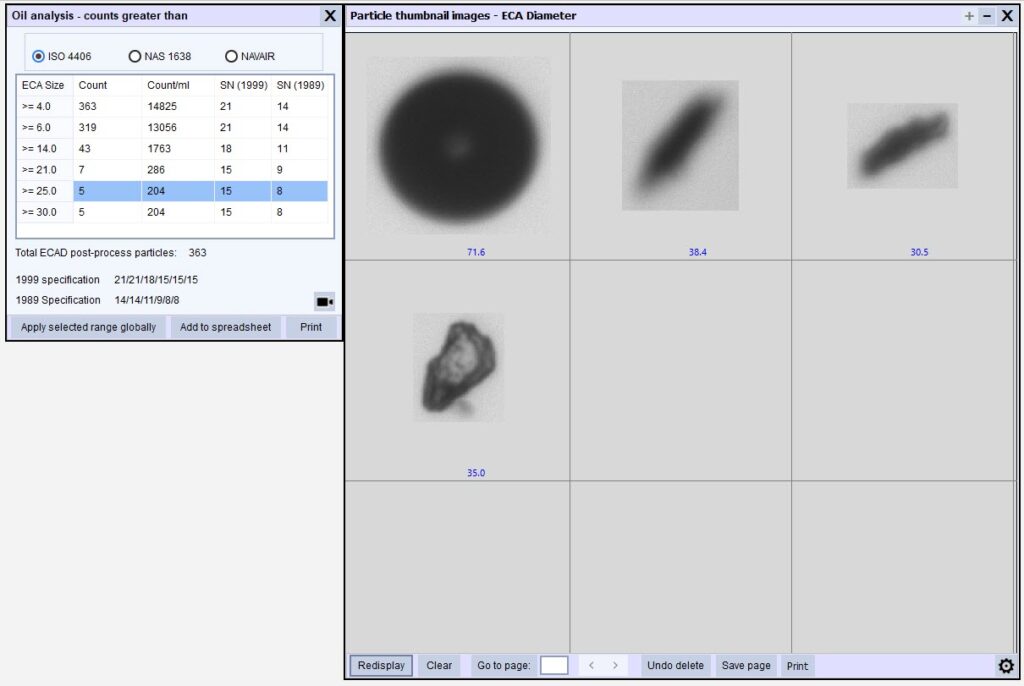
What else can the Raptor offer that the APC can’t?
First of all, the Raptor can show you the particles that were identified in each class with one click. For example below you will see some of the thumbnails that were greater than 4 microns. The second picture shows the particles greater than 25 microns. Notice the large air bubble that was found. This can be ignored. But if this was a water droplet, it could mean a different problem.
Having this information in the field will allow the user to know what the particles are and make educated decisions at the point of testing.
Secondly, remember that the Raptor is portable, so the intention is to NOT send samples back to the lab. Analyze your samples in the field and images allow you to make immediate decisions, No experts required.
ISO Alignment Without Compromise
While ISO 21018-1 acknowledges that newer technologies can’t match the national calibration path of ISO 11171, the Raptor system proves that image-based technologies can still deliver quantifiable and reliable data—and then go beyond it.
The Value of Visual Data
Every Raptor analysis produces:
- Size and shape metrics for each particle
- High-resolution thumbnails
- Classified results based on morphology (e.g., fibers, flakes, spheres, irregular particles)
This visual and morphological data is indispensable for root cause analysis, filter performance studies, and early failure detection—capabilities that light obscuration simply can’t provide.
Learn More or Book a Demo
Ready to bring your contamination analysis into focus?
👉 Contact us for a demo
