

Testing LCM Samples with the Dry Powder System
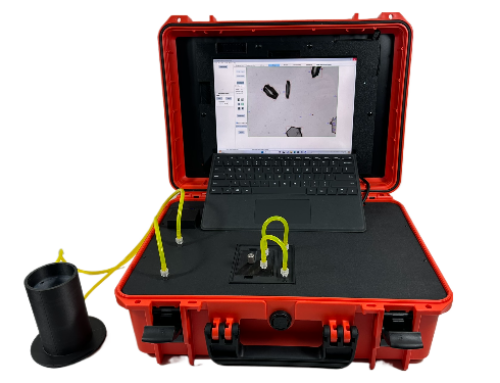
In our latest lab session, we ran a batch of dry powder samples using our Raptor dynamic imaging system. This time, we tested lost circulation material (LCM) samples generously provided by the team at OHS Resources. These materials, often used in wellbore applications to mitigate fluid losses, present a unique mix of particle sizes and shapes — making them ideal for showcasing our instrument’s advanced capabilities.
Previously, we analyzed these samples using a wet dispersion method, but for this run, we shifted to a dry dispersion configuration to explore how the system handles larger, coarse particles in their natural state.
From Sample Loading to Real-Time Analysis
The process began with sample insertion into the vibratory feeder. Within seconds, we were able to observe real-time particle size distributions:
- Number-weighted distribution revealed a concentration of fine particles, including those around 20 microns.
- Volume-weighted distribution captured the presence of coarse particles, extending well beyond 1,000 microns — even approaching 2,500 microns.
The system’s intuitive interface allowed us to visualize these measurements live, while simultaneously capturing high-resolution images of each particle.
Going Beyond the Numbers: Interactive Particle Classification
After the run, we moved straight to the analysis dashboard — one of the most powerful tools in the platform. Here’s what we explored:
🎯 Custom Classifications
Using the dashboard’s classification features, we grouped particles by size and shape:
- Large particles: Defined as 500 to 2,500 microns, mostly elongated in shape.
- Small particles: Those under 500 microns, comprising 61.7% of the total population.
- Long particles: Set by an aspect ratio > 3:1, showing clear structural elongation.
- Rough particles: Identified by high edge complexity or perimeter variation.
🖼️ Thumbnail Navigation
Instead of scanning through over 7,000 particle images, classification allowed us to:
- Focus only on the particles of interest.
- View distinct morphological features.
- Quantify each class by percentage contribution to the sample.
This approach transforms what would be a tedious visual inspection into a fast, insightful, and data-driven particle characterization process.
Final Thoughts: Why It Matters
Whether you’re in oilfield services, additive manufacturing, or quality control, understanding particle size and shape distribution is crucial to predicting material performance. By applying dynamic image analysis to LCM materials in both wet and dry configurations, we gain a fuller understanding of their behavior.
A big thank you to the OHS Resources team and to Peter Osborne for the sample contributions. This kind of collaboration showcases the power of modern particle analysis — not just in theory, but in real-world applications.


