Basics of Particle Characterization
Size and shape are the attributes that most affect the behavior of particulate substances. Spherical beads are easily characterized by a single size measure – diameter. More irregular shapes are more difficult to characterize, but for powders used in manufacturing it is necessary to find a small set of numbers that describe the sample as a whole and that will predict performance. The kinds of shapes present in the sample will determine what size and shape parameters are needed.
Because of the large number of particles, size and shape data are statistical. Histograms are the best way to portray statistical distributions of a variable or measure, and there are various means and measures of spread to characterize a distribution using just a few numbers.
1 Distribution histograms
To show the sizes present in a sample, the size range is divided into small size classes or “bins”, and we count the number of particles present in each size bin. The graph below is a size histogram and it presents a good picture of the actual distribution. Size data is normally shown graphically on a log scale axis, to better show the small sizes.
 Typical size data histogram
Non-size data such as circularity, smoothness or aspect ratio is shown on a linear scale:
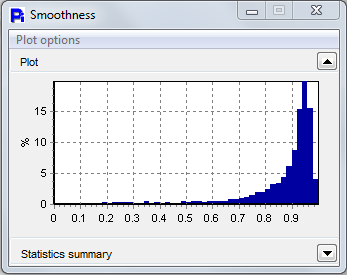 Typical linear axis histogram
The more finely the axis is divided, the more accurate will be the means and distribution shape figures that are derived from the histogram. If the divisions are too fine, there may be bins with no counts, and these will show up as gaps in the graph, especially at the low end on a log axis. In the Particle Insight the number of divisions and the size range are settable in Analysis Conditions.
A volume-weighted histogram plots the relative volumes present in the size classes:
 A volume-weighted histogram
The volume distribution can be computed accurately only if particles are spherical or if there is accurate shape information. Inferring a volume distribution from single size measure counts will not be accurate if particles are non-spherical.
Surface area weighting can be done in a similar way and with the same caveats. On a log scale, a number (unweighted) plot emphasizes the small sizes, while volume weighting emphasizes the large sizes and may not show the smallest sizes at all. Weighting by surface area will be in between number and volume.
The chart below illustrates the difference between number and volume weighting.
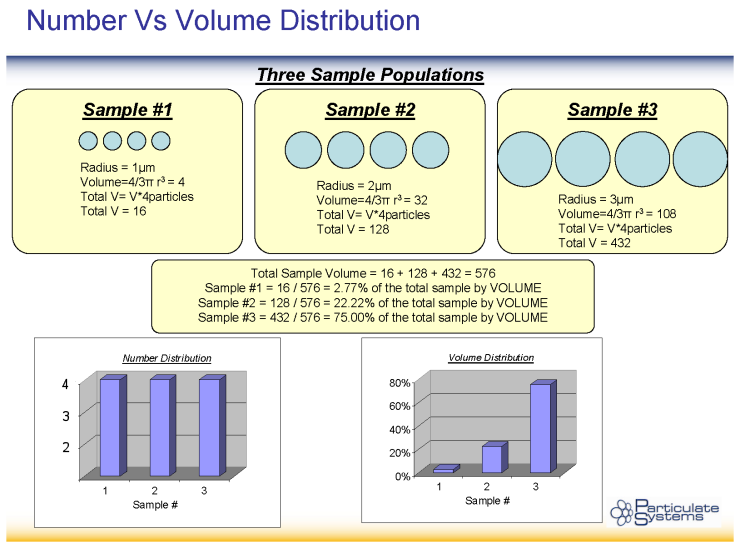 Difference between number and volume weighting
The graphs will be smoother if the particle count is 10,000 or more. Even with a high count, if there are very small sizes present in the sample, sometimes there will be some size classes or “bins” near the low end that do not show any counts, as in the plot below:
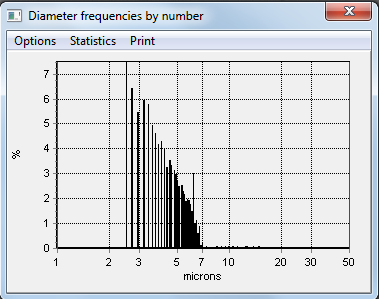 Empty bins near low end
This happens because particle areas are determined as an integer number of pixels, and the micron equivalents of 3 and 4 pixels, for example, might not fall in consecutive bins. One or more size bins may be skipped. This effect is seen mainly with lower-resolution cameras (1 megapixel or less). It is also affected by the size calibration.
The volume-weighted histogram often shows isolated counts at the high end, as in this example:
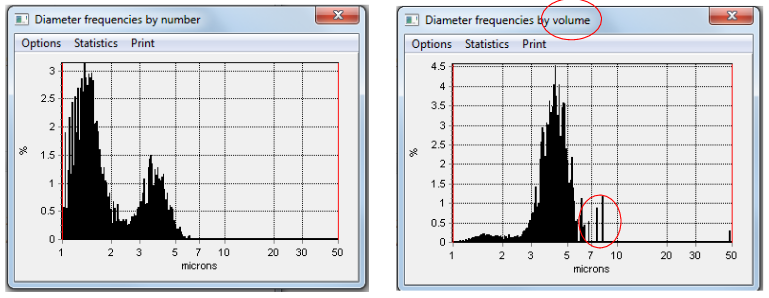 Isolated spikes near high end
This happens because a single very large particle can represent a significant part of the total volume, and therefore on the volume-weighted histogram that single count will be prominent. Camera resolution is not a factor in this effect.
2 Characterization of distributions
2.1 Means
A mean characterizes a distribution as a single number. A mean value gives you some indication of the sizes present but does not convey any information about the shape of the distribution or how wide or thin it is. The number or arithmetic mean is simply the average value. It is often denoted as D1,0. There are other means that take into account area and volume weighting.
The general definition of a weighted Dp,q mean diameter, assuming sphericity of particles, is
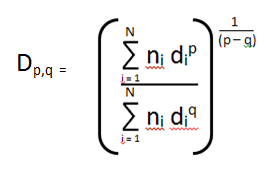
Definition of Dp,q means
The diameter means that are most-commonly used to characterize a particle sample are:
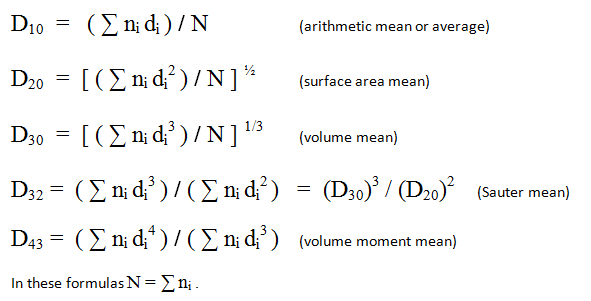
In these definitions ni is the count in size bin number i, and di is the representative diameter of that size bin. The sums are over all particles, and N is the total particle count.
Below are descriptions of these means in words:
Arithmetic mean diameter, D[1,0] : the average of the diameters of all the particles in the sample.
Surface mean diameter, D[2,0] : the diameter of a particle whose surface area, if multiplied by the total number of droplets, will equal the total surface area of the sample.
Volume mean diameter, D[3,0] : the diameter of a particle whose volume, if multiplied by the total number of particles, will equal the total volume of the sample.
Surface moment mean diameter, D[3,2] (“Sauter mean”): the diameter of a particle whose ratio of volume to surface area is equal to that of the complete sample. Mathematically it will be seen that if V is the total volume and A is the total surface area of the sample, D3,2 = 6 * (V / A).
Volume moment mean diameter, D[4,3]. This value is a better indication than the other means of what particle sizes contain most of the volume.
The Mode is the most frequent size present.
The Harmonic mean is ![]()
2.2 Geometric means
Geometric means reflect the visual weighting of a log size axis. That is, the geometric mean diameter will look like the center of a distribution on a log scale, while the normal arithmetic mean may lie much lower on the size scale (due to the small sizes being much more numerous than the large sizes).
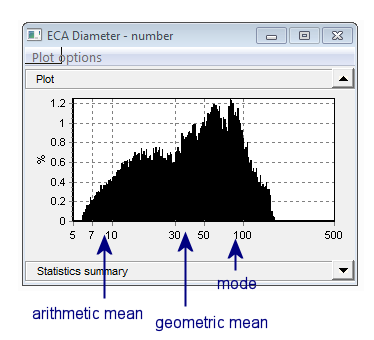 Arithmetic and geometric means
To compute the geometric mean, use the logs of the x axis values ( log (di) in place of di ) :
The Geometric mean is ![]()
The geometric versions of the other means and standard deviation may be calculated in the same way.
2.3 Measures of spread
Standard deviation is a measure of how wide the distribution is:

where μ = mean diameter (D10). It has units of microns (for a size distribution).
The Coefficient of Variance is the ratio of the standard deviation to the mean: CV = σ / μ . To express as a percent multiply by 100. This statistic, being a ratio, does not have units.
2.4 Percentiles
Percentiles are a way of conveying size information as one or more numbers. The Median size divides the particles into two halves containing equal counts. Strictly speaking this is the Number Median. It is also called the 50th or the 50% percentile.
The 10th percentile defines the size with the property that 10 % of the particle count is less than that size. Any other percentile can be defined similarly. Often three percentiles (10%, 50% and 90%) are used as a characterization that is simple but more informative than a single mean.
The Volume Median, or 50th percentile by volume, divides the volume of the sample into two equal halves. The two classes will contain equal volume but not equal particle counts. Other volume percentiles are defined similarly; for example the 25th volume percentile is the size such that particles smaller than that size represent 25 % of the volume.
2.5 Other characterizations
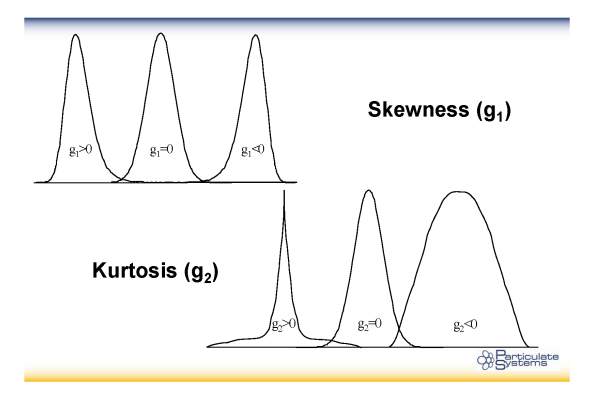
Skewness indicates how unsymmetrical the shape of the distribution is, about the center. A positive value means there are more counts on the right side of center, usually in the form of a tail. A negative value means it tails to the left.
Skewness = ![]() (σ = std. dev., μ = mean)
(σ = std. dev., μ = mean)
Kurtosis is an indication of how much the shape deviates from the usual bell curve, in a vertical sense.
Kurtosis = ![]() (σ = std. dev., μ = mean)
(σ = std. dev., μ = mean)

