
Particle Measurement Technologies. How are they different?
Fine particles play essential roles in determining the characteristics of both natural and man-made materials and have considerable influence on processes such as dissolution, adsorption and reaction rate. In most cases, these effects are a function of either the size, shape, surface area or porosity of the individual particles or of an agglomeration of particles. These particle-related characteristics must be controlled in order to optimize the desired effects, and efficient control requires measurement. There are multiple techniques for determining the same particle dimension and each has its advantages and disadvantages. Selecting a technique that is inappropriate for the application can have a deep impact on the quality of the measurement you obtain.
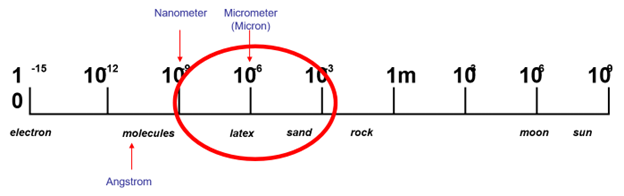
Most industrial particles fall into a similar size region shown below.
Also, as mentioned above, there are many techniques that can satisfy different applications if only comparing them by the size range they address.
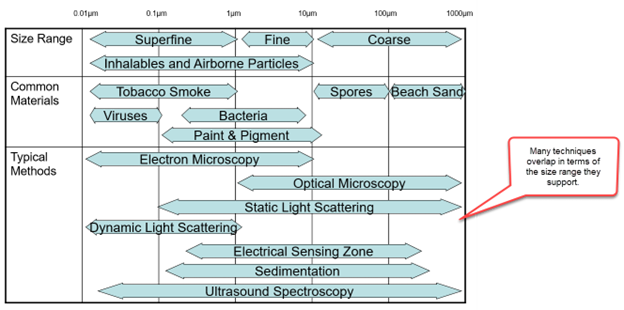
Because there are so many techniques that can address similar size ranges, it is very important to understand the differences in the techniques to best select the one that suits your application properly. Besides size, other needs of customer samples must be taken into consideration. For example, if particle counts and concentration is important there are specific counting techniques available such as dynamic image analysis, light blockage, and electrical sensing zone also known as the Coulter Principle. The same would apply if a customer is interested in suspending their sample in a wet / organic medium or in a dry medium. There are many different reasons to select one of the many different methods for particle analysis.
It is equally as important to understand that different techniques, although we’ll report particle size, will give slightly different results. In some cases, depending on the shape of the particle, the results can be more significant. It is important to understand that neither technique is wrong. Just slightly different. To point out this, a study was done several years ago with the cooperation of Vision Analytical, Micromeritics Instrument Corporation, and MVA Scientific Consultants.
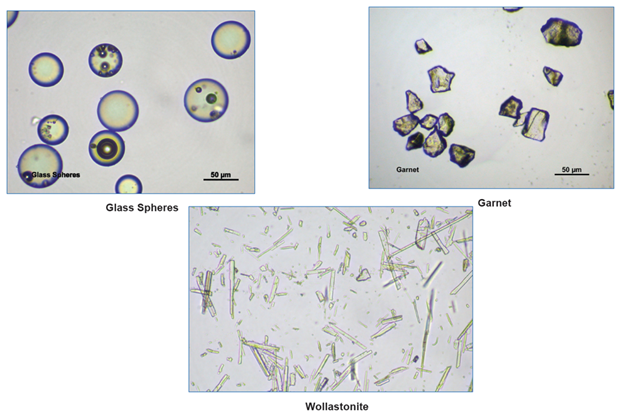
In this study, there were three different sample types selected. The different sample types were selected based on their different shapes. Below is a picture of the three sample types. The first was a glass bead which is typically very round and approximately 50 microns in size. The second sample was a garnet sample. Garnet particles are typically used as abrasives for material removal. As such, they are very irregular in shape and when measured using a size-only technique, resulted in a 50 Micron size as well. The last sample selected was Wollastonite, which is mined and has many industrial applications. Wollastonite, very different than glass beads or garnets, are very long and needle-like in shape.
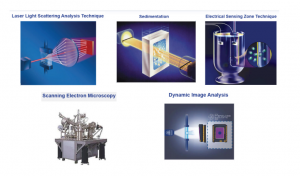
There were several techniques used to analyze these three particle types. Laser light scattering, also known as laser diffraction, is a very popular technique for particle size. Laser diffraction calculates particle size by an indirect measurement. Laser diffraction will measure the angular light intensity scattered from particles and perform a mathematical calculation to render particle size assuming all particles are around.
The second technique used was sedimentation. This technique uses Stokes’ law to measure particle velocity as it relates to particle size. Again, being an indirect measurement of particle size, data results will be displayed assuming all particles are round in shape.
The third technique used was Electrical Sensing Zone, or the Coulter Principle, where particles suspended in a conductive liquid pass through a narrow orifice where particles are counted and the voltage change as particles pass is proportional to particle volume. Once again, an indirect technique that assumes all particles are round in shape.
Lastly, dynamic image analysis was used where a direct measurement of every particle is made by taking images or photographs as they pass through a detection zone. Measurements, including size, are based on the two-dimensional projected image of every particle. This is a direct measurement technique which can give size as well as shape information.
What results did we get and how do they compare?
Glass Sphere Results
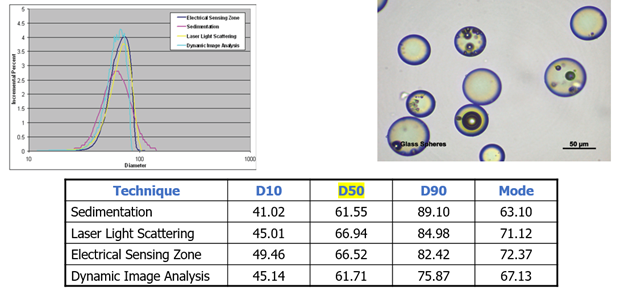
One would expect similar results here for each technique, since the glass beads are nearly spherical and the various methods relate size to an equivalent sphere. The median (D50) results are very similar for all the particle size methods.
Analyses of Glass Spheres using four particle size distribution techniques show that although there is close agreement in the D50 values, there is some broadening in the distribution with some techniques more than others. Keep in mind that the measurement being used here for All techniques is SIZE assuming all particles are round.
Garnet Results
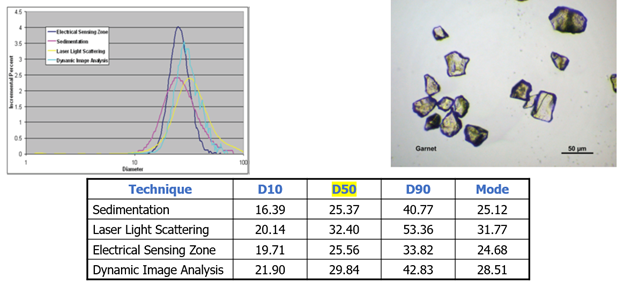
Garnet is not spherical; rather, it is more cube-shaped. With cube-shaped samples, the diagonal distance between opposite corners is longer than the diameter of an equivalent volume sphere by about 30%. Therefore, the results are larger with the flowing techniques (light scattering and image analysis) than with the instruments which are sensitive to the equivalent spherical diameter.
Analyses of Garnet samples using four particle size distribution techniques show less agreement in D50 values. Note that now that the particles are truly less-round, the statistical histograms are broader. Again, Keep in mind that the measurement being used here for All techniques is SIZE assuming all particles are round.
Wollastonite Results
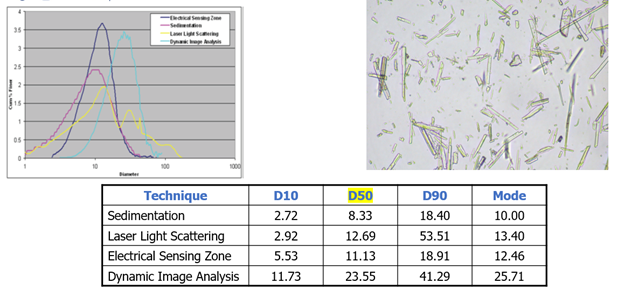
The same flow and shape effects that resulted in slightly different garnet particle sizes are more pronounced with the rod-shaped Wollastonite. The light-scattering technique sees the largest particle dimension. The electrical sensing zone and sedimentation techniques report a particle diameter equivalent to a spherical measurement. Light scattering has a thicker flow path than the image analyzer and therefore some particles can be oriented with the smaller size exposed to the detection system.
Analyses of Wollastonite samples using four particle size distribution techniques show very little agreement in D50 values. These techniques are assuming that these fiber-like particles are “round” which shows how little agreement there is and the greater differences in the statistical histogram on size.
What are some of the technical reasons that there are differences?
Summarizing some of the technical reasons that there will be differences and that the differences increase between techniques as particle shapes become less round are listed above. However a few other things that need to be pointed out are listed below.
Number based techniques such as dynamic image analysis and electrical sensing zone have the ability of reporting a volume weighted size distribution as well as a number-weighted size distribution. When doing comparisons with other techniques that primarily report volume-weighted statistics, it is important to select this same type of weighted statistic on the number based techniques. This will enable the user to have a closer apples-to-apples comparison, as they say.
Each technique will have its own difference in how the physical measurement is made And what impact it can have on particle size.
- With respect to sedimentation, the velocity of particles falling in a liquid is based on the drag on envelope surface of the particle. In addition, the material properties such as the skeletal density can impact the particle size in sedimentation. Heavy particles will sediment faster.
- For laser diffraction, the correct refractive index of the sample and the medium it is suspended in is very important. Care must be taken when entering this information accurately to ensure adequate size results. Both real and imaginary refractive indexes may be needed depending on the size and optical mathematical model being used.
- Electrical sensing zone will measure the displaced particle volume. There are no specific properties needed to know before the measurement is done. However, it is important to realize that a round particle and irregular particle we’ll have different volume displacements.
- Dynamic image analysis makes measures based on 2-dimensional projected cross section areas of images of particles. There are no specific optical properties required to make a calculation.
In conclusion, it is important to understand that although there may be differences in size results between different techniques especially when it comes to irregular particles, no result is incorrect. As can be seen by the results although there may not be complete agreement, there is a correlation and if the user understands the shape properties of their particles, they can’t understand the types of results that they’re getting regardless the technique.
To see this article on Azo Network, please click here..