The challenge
There are many different varieties of pollen within various species. Several varieties of pollen were analyzed using Dynamic Image Analysis to test if their morphology (shape characteristics) could be used as a differentiator among the various types, and to differentiate between whole pollen grains and pieces or debris. Size-only methods often cannot make this distinction.
| Applicable measures |
Measure
|
Range of acceptance
1 – 500 microns |
Procedures and Results
A total of six different varieties of pollen samples were studied: Alder, Short Ragweed, Pecan, Redtop, Timothy Grass, and Paper Mulberry.
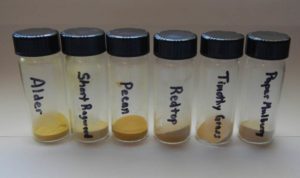
All samples were prepared by suspending them in water and dispersed prior to analysis. Particle size-only instruments will report results assuming all particles are round or spherical in shape. That may be acceptable for some samples that are uniformly-shaped, but where shape differences exist this technique is not adequate. It will be shown that shape, not only size, is a better tool to differentiate between various types of pollen.
The Particle Insight was able to analyze thousands of particles in just a few minutes and show results of up to 30 size and shape measures. The Particle Insight was also able to perform detailed statistical analysis of the shape of these pollen particles as well differentiate them based on these shape statistics.
Timothy Grass Pollen


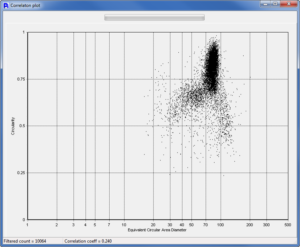
The Timothy Grass Pollen showed a unimodal size but with broad Circularity. Thumbnail images offer confirmation that there are some round particles that are uniform but there are also some particles that may be debris or parts of broken pollen particles. The Correlation Plot allows the user to compare any two measures. In this case, Circularity Vs. Size was plotted to get additional characteristics of the outlying particles.
Red Top Pollen

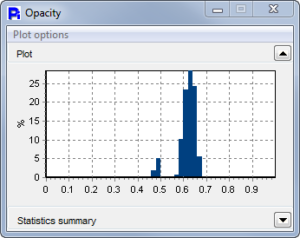
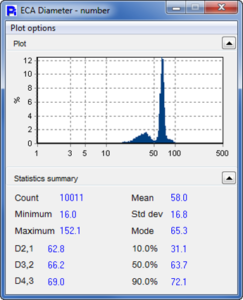 Red Top Pollen grains are dark but with varying Opacity values. There were also debris particles and portions of broken pollen present.
Opacity is a very useful tool. It is a measure of the particle’s intensity mean calculated as a fraction between 0 and 1: 0 is fully transparent and 1 is fully opaque (black). The Opacity for the Red Top Pollen shows a clear bi-modal distribution. The Particle Insight is capable of showing and sorting the particles by any measure including Opacity.


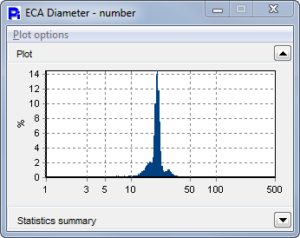
The debris particles, besides being shown in the thumbnail images, are statistically shown here as the smaller sized particle group in the ECA Diameter distribution. A correlation plot would show that these correspond to the particles with low Smoothness.
Paper Mulberry Pollen
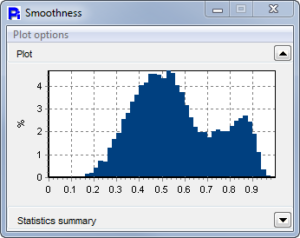
Paper Mulberry Pollen has a very uniform size and Opacity as can be seen from the statistical histograms. The Smoothness graph shows a bimodal distribution, indicating two classes of pollen grains. As can be seen by the thumbnails, the less-smooth particles seem to be full pollen particles but of a different shape.


Pecan Pollen

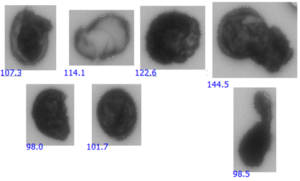
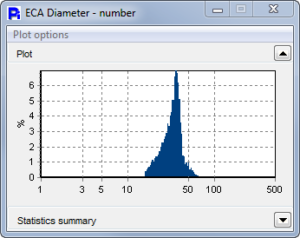
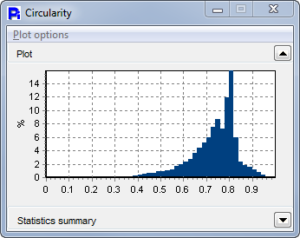
Pecan Pollen is an excellent example where we can show that size data is not everything. The ECA Diameter shows these particles to be very unimodal, and we might assume they are all round. However, once the Circularity, Smoothnes and Opacity is reported, we can now see that there are a very wide variety of particle shapes.

Short Ragweed Pollen
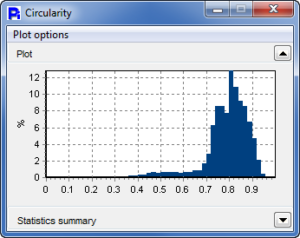
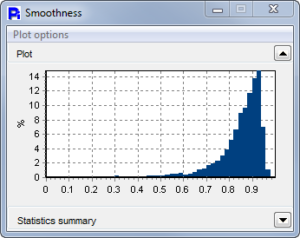
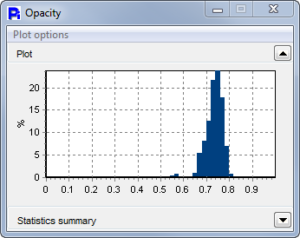
Short Ragween Pollen has a very uniform Size, Circularity, and Opacity.


Alder Pollen


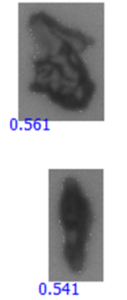
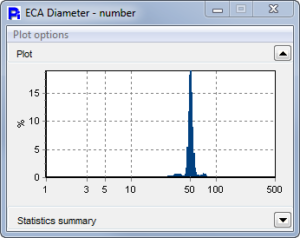
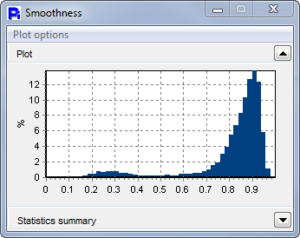
Alder Pollen data shows that a major portion of the particles have low Smoothness. As was shown by the thumbnails, this was caused by some debris that was not similar to the pollen. This information may be useful in improving the collection process of the pollen.


Customizable Statistical Reports

Keeping in mind that the Particle Insight performs high speed analysis of particles in real time, every particle measured not only has a saved thumbnail image but also has each shape measure determination saved, as well as the frame number it was found in. All this data can be reported in numerous ways besides the statistical histograms we have shown. Excel spreadsheets can also be created for individual samples or as comparisons, as shown above.
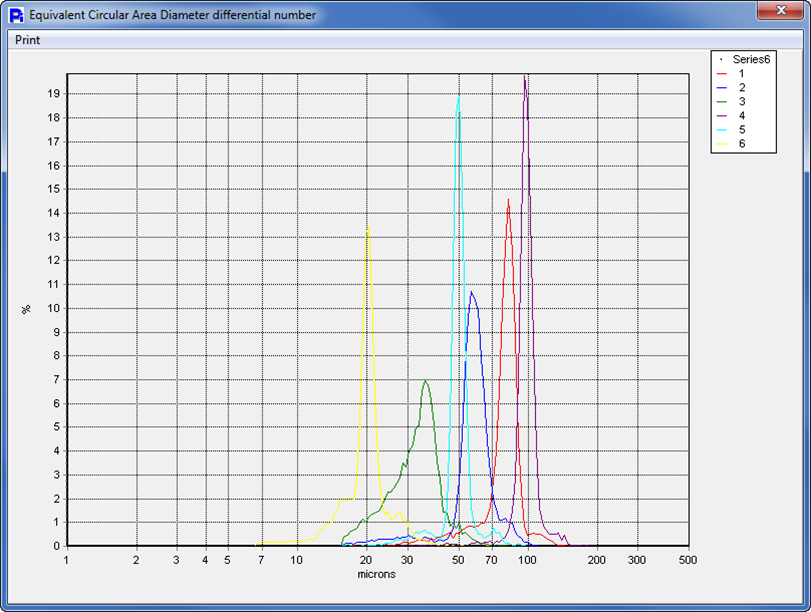
By doing an overlay of all the pollen samples and comparing not only their size, but also their shape, we can do an in-depth comparison of how these pollens compare and differ.
Here we can see that for the most part, all samples are rather uniform in particle size. But we have seen that they are not uniform in shape. This fact can be useful to develop a fingerprint for each pollen sample and detect just how much cross pollen species are in any specific sample. The Particle Insight has a unique feature called Particle Classification that can simplify this operation.
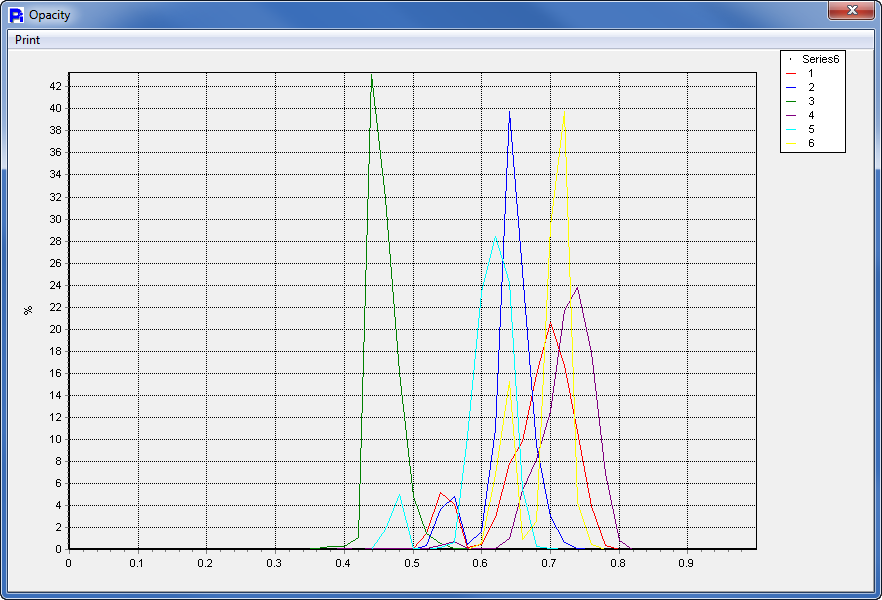
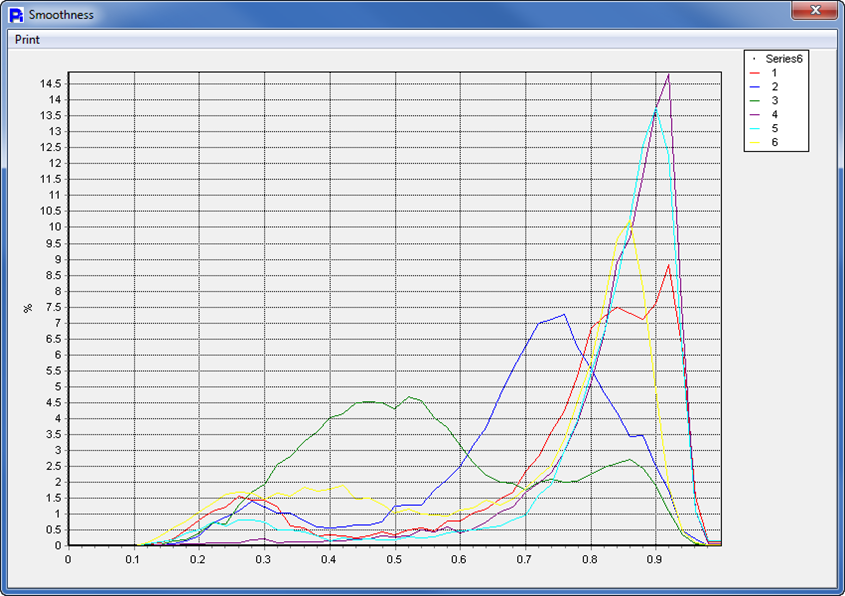
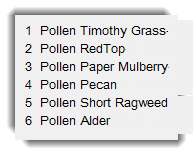
Here we can see that by comparison, the Opacity and the Smoothness of all the pollen samples are slightly different. However the Paper Mulberry pollen is dramatically different in Opacity as well as Smoothness (green line in overlay graphs).

Even though the Paper Mulberry Pollen was drastically different in Smoothness and Opacity, here we see that with Circularity, the outlying pollen samples are the Red Top and the Alder Pollen.
Conclusions
After analyzing six different pollen samples, we can clearly see the differences in the species not only by size but more so by alternative shape measures such as Circularity, Smoothness, and Opacity. In addition to being able to differentiate between species, we were also able to show how within each pollen sample, there could be dual populations of Opacity and even Circularity. The Particle Insight shows the ability to not only determine up to 30 size and shape analysis measures for each particle measured, but is also able to determine concentration and report data in a wide variety of ways.

