The challenge
Obtain accurate size distributions of polystyrene spheres, ranging in diameter from about 3 to 125 microns. Number, surface area and volume weighting are calculated.
Applicable measures
Measure
Equivalent circular area diameter
![]() Circularity
Circularity
Range of acceptance
3 – 500 microns
0 – 1.00
Typical image


Notes
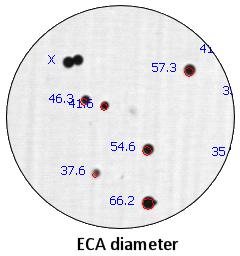
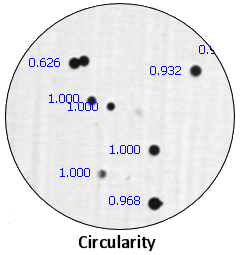
ECA diameter is the diameter of a circle having the same projected area as the actual particle. With spheres, it is the natural measure to use. Beads sometimes cluster together – how do we eliminate those from the analysis? By using shape rejection: any object having a circularity value below 0.80 is ignored. In the sample image, there is a double that shows a circularity of 0.626 (we turned off the rejection temporarily to show the value). That cluster is bypassed in the data accumulation.
Results

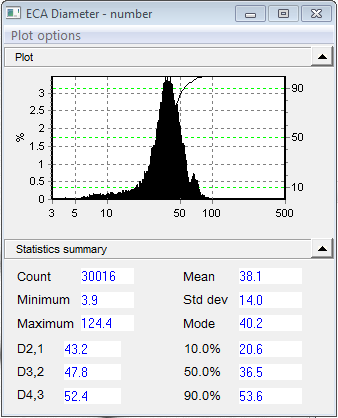
The ECA histogram graph shows that the particles do not have a simple normal distribution; there is a tail of small particles on the left side, and a secondary peak at around 60 microns. The accepted (in-focus) particles ranged in size from 3.9 to 124.4 microns. The mean, in this case 38.1, is often used as a “single number” characterization of a sample. The percentiles (10%, 50%, 90%) give more information of how the data is distributed about the mean.
The logarithmic size axis gives a better visual representation of the distribution near the low end than a linear axis would. It “stretches out” the low end.


When the distribution is weighted by surface area, the low-end tail disappears because those particles contribute essentially nothing to the total surface area. The small peak at 60 is larger because it now represents a larger fraction of the sample surface area. The whole distribution shifts right slightly.

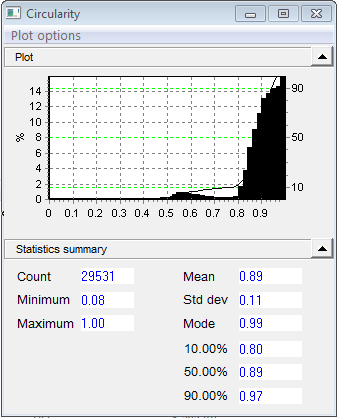
This Circularity plot shows the circularity histogram when shape rejection is turned off. A check of particle thumbnail images shows that the counts below 0.8 represent clusters of spheres. When shape reject is set up to bypass objects with circularity less than 0.8, that part of the circularity histogram disappears. If the small peak at 60 microns in the size graph goes away under the shape rejection, you can conclude that it represents these particle clusters.
The Comprehensive Statistics characterize the sample in greater detail, using commonly-accepted statistics for histogram data. The Arithmetic values come from the original data and correspond visually to what the histogram would look like on a linear size axis. Geometric stats reflect the visual appearance of the distribution on the log axis; for example the graph is skewed right in one case and left in the other.

The volume graph shows the same effects, to an even greater degree. Volume weighting is used when the volume of individual particles most affects what happens, such as in some chemical reactions.

