Comparing Image Analysis to Other Techniques

Industrial particles fall into the small microns size range.

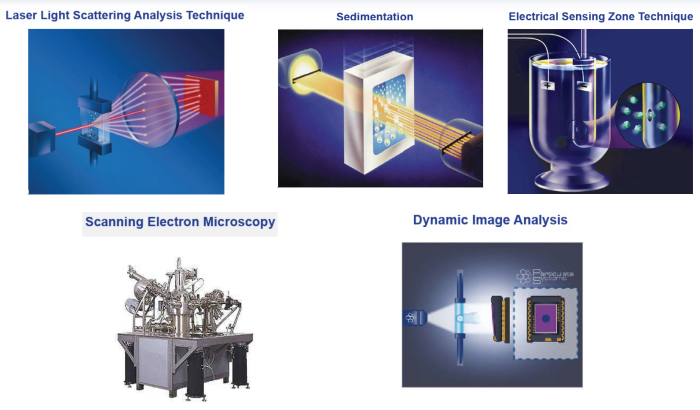
A size measurement method must match the sizes present.
Comparing methods for three sample types

Here we see three quite different sample types
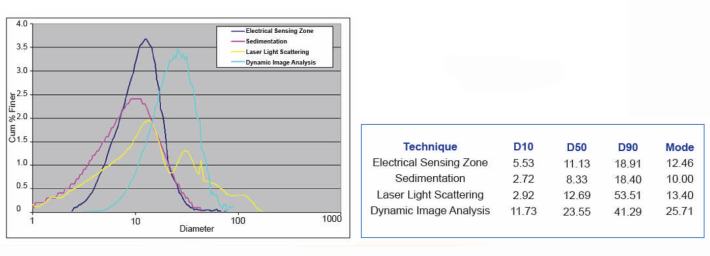
Glass sphere results
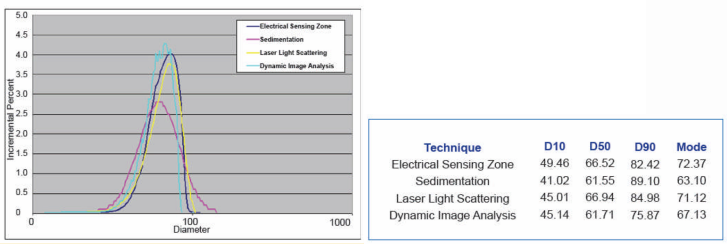
One would expect similar results here for each technique, since the glass beads are nearly spherical, and the various methods relate size to an equivalent sphere. The SediGraph result produces a slightly broader frequency distribution. This is due to a density gradient which exists in the glass spheres. The median (D50) results are very similar for all the particle size methods.
Garnet results
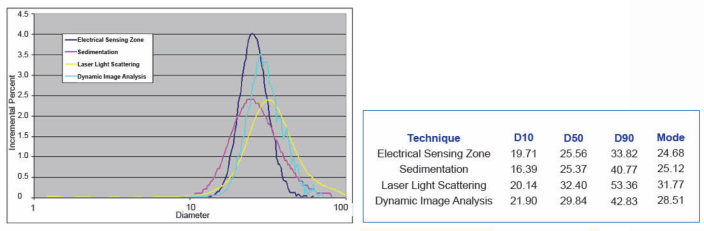
Garnet is not spherical; rather, it is more cube-shaped. With cube-shaped samples, the diagonal distance between opposite corners is longer than the diameter of an equivalent volume sphere by about 30%. This is why the results are larger with the flowing techniques (light scattering and image analysis) than with the instruments which are sensitive to the equivalent spherical diameter.
Wollastonite results
The same flow and shape effects that resulted in slightly different garnet particle sizes are more pronounced with the rod-shaped Wollastonite. The light-scattering technique sees the largest particle dimension. The electrical sensing zone and sedimentation techiques report a particle diameter equivalent to a spherical measurement. Light scattering has a thicker flow path than the image analyzer and therefore some particles can be oriented with the smaller size exposed to the detection system.
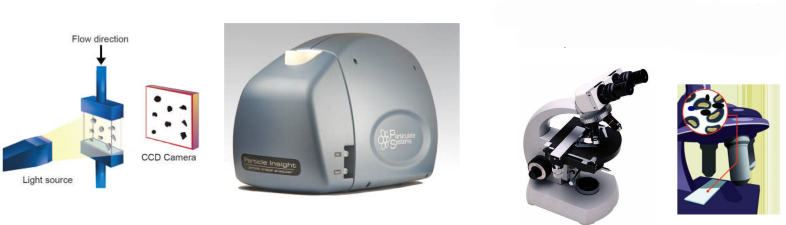
Image Analysis – Creation from Two Perspectives
|
Dynamic Image Analysis • Evolved from a Laser Diffraction perspective |
Static Image Analysis • Evolved from a “microscope” perspective |