
Reasons You Need A Particle Shape Analyzer
Are you concerned that particle size analysis is not enough to solve your process & quality problems?
Do you still have questions such as ….
You have accumulated an extensive history of particle size distribution data used to predict your products performance.
Still sometimes particle size targets are insufficient to maintain product objectives. These variances in laser diffraction results need to be addressed/redefined to be effective. Above are questions you need to answer to maintain maximum product performance.
This Application Note details usage of particle shape to address the need to confirm your sample preparation procedure is ideal.
Seeing All Shape Measures Matters: Here Is Why
Laser diffraction instruments measure angular light scatter which is then calculated to give the end user a measurement to an equivalent circle of “X” diameter. Scatter models use the “Mie or Fraunhoffer Theory” to define the particle size that best fits the light scatter measurement.
However, the same particle gets recirculated and is viewed from alternate perspectives resulting in different circular diameters for the same particle.
Hence laser measurements can only be viewed as a distribution and cannot be used to review any specific particle.
The Sentinel Particle Insight also views the same recirculated particle but captures images of each particle view for post analysis to select the best shape model.
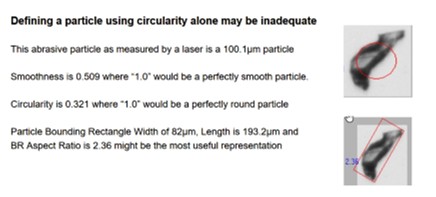
Bounding Rectangle Width Measurement Defines Differences Within This Sample
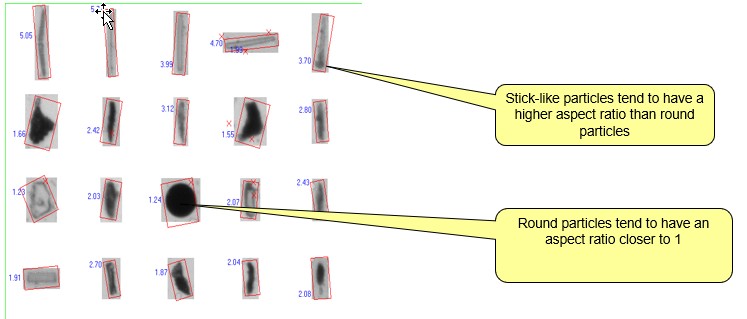
Review of images of small fiber like particles when compared to more circular particles, classifies meaningful ranges of Bounding Rectangle Aspect Ratio. Thin long particles have a higher BR AR number. More round particles have a BR AR closer to 1.0. So continued use of BR AR allows additional classifications.
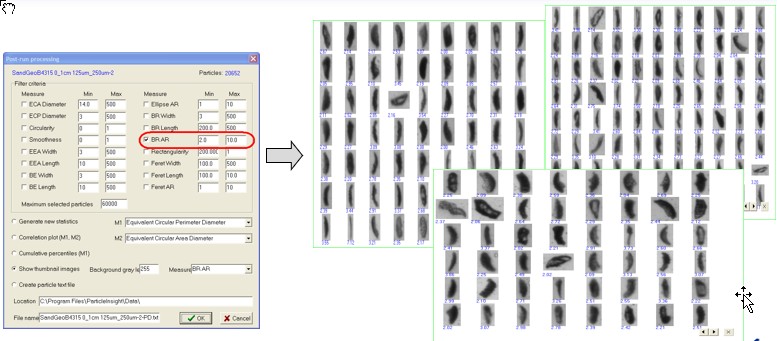
Bounding Rectangle Aspect Ratio from 2.0 to 10 Results
Review of images of small fiber like particles when compared to more circular particles, classifies meaningful ranges of Bounding Rectangle Aspect Ratio. Thin long particles have a higher BR AR number. More round particles have a BR AR closer to 1.0. So continued use of BR AR allows additional classifications.
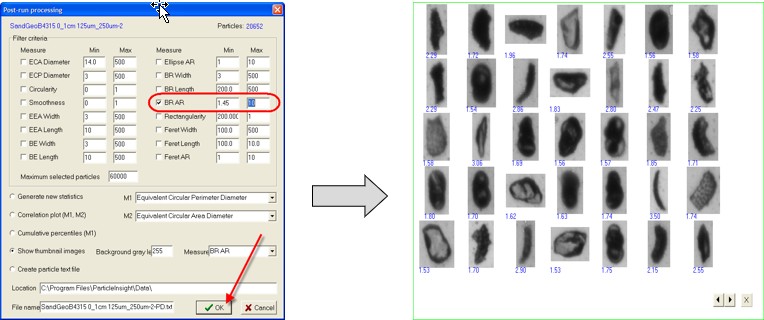
Bounding Rectangle Aspect Ratio from 1.45 to 10 Results
The Sentinel Particle Insight Pro software allows one to select and view particles for any specific range.
Images of BR AR between 1.45 to 10 shows depths and lengths of particles that are potential ideal candidates for superior abrasive prosperities.
Bounding Rectangle Aspect Ratio Statistics Above & Below 2.1
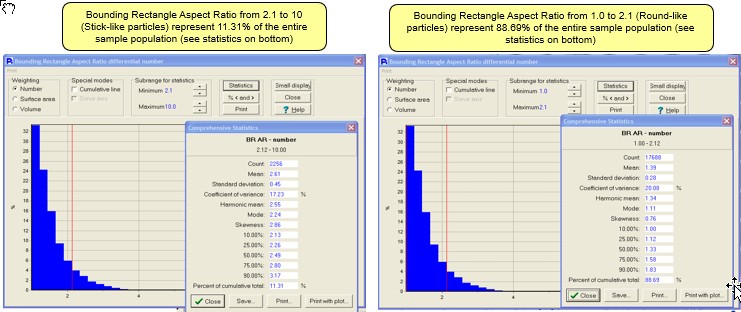
The Sentinel Particle Insight Pro software presents a scaled distribution of a shape model, BR AR, and move a red selection line for focus on statistics within any range. The total number of particle images collected are 19,944. 2256 particles, or 11.31 % of the total sample measure a BR AR from 2.12 to 10. 90 % of these particles have a BR AR below 3.17. 17,688 particles, or 88.69 %, measures a BR AR from 1.0 to 2.12
90 % of these particles have a BR AR below 1.83
Correlation Between ECA Diameter & BR AR Shows Outliers
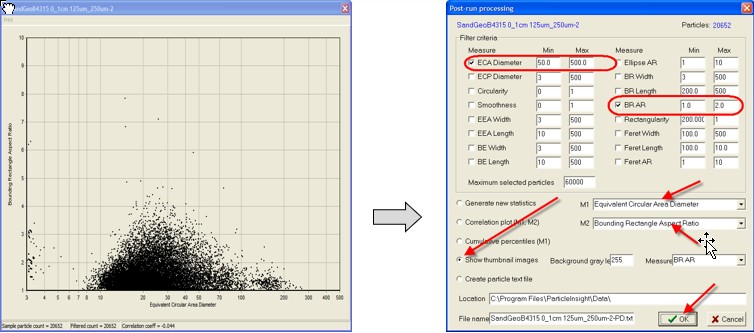
The Sentinel Particle Insight Pro software allows us to select two (2) model measurements and present them as a correlation plot. The graph shown represents all 19, 944 data points correlating ECAD to BR AR.
Please note the outlier grouping of particles above 50 um ECA diameter. We can just select particles above 50 um and a BR AR range of 1.0 to 2.0 and see images of these select few particles.
What Do Those Particles Greater Than 50 um Look Like?
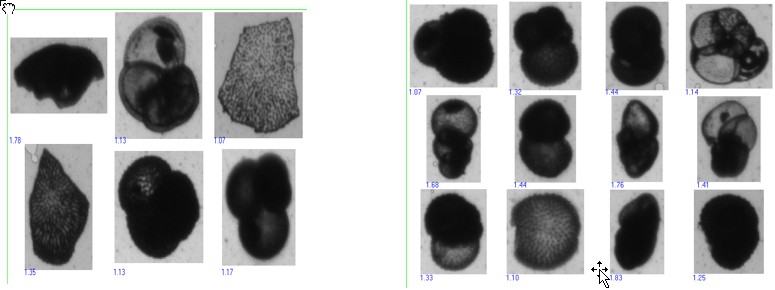
These particles show more rounded shapes very different from the more conforming characteristic angular shapes typical of abrasives. Furthermore, many of these images show agglomeration, perhaps more than one particle per image and broken particles. Strange images to be contained in an abrasive sample.
See What Particle Shape Brings To The Party?
What did we learn looking at shape…
Laser particle size cannot tell you the whole story if the particles are far from circular.
We discovered that Bounding Rectangle Aspect Ratio is a better comparison than circularity.
88% of the particles have a laser size from about 1 to 50 um with an BR aspect ratio of 1.0 to 2.1
Particles that are larger than 50 um tend to have a low aspect ratio under 2.1.
1429 Particles or 6.9% of the total population are particles greater than 50 um.
Particles larger than 50 um have a low BR AR and are clusters and agglomerates
Many of these particles are clusters or broken portions from larger particles.
Particles larger than 50 um need a better sample preparation method as some will disappear with better sample preparation.
We answered one of the original questions: “Are you using the best sample preparation procedure to define particle size results?”
No, we need to improve sample preparation to avoid large doublets & agglomerates.
Single Purpose Of A Surfactant Is To Remove Surface Tension Between Particles
Guidelines how to reach an acceptable sample preparation method.
Selecting A Surfactant, Mixing and Using Sonification; Carefully Select Sonification Power And Duration
Guidelines how to reach an acceptable sample preparation method using mixing & sonification.
Confirm Newly Selected Sample Method Produces Repeatable Results
Confirm Repeatable Results From Additional Aliquots From The Same Sample