Sieve correlation has been a well-established method in particle sizing for many years, but the development of automated dynamic image analysis is beginning to revolutionize the process. In this blog post, we will discuss how automated dynamic image analysis is becoming a complementary method to sieve correlation and how it provides more accurate and detailed results.
What is the Most Efficient Alternative to Sieve Analysis?
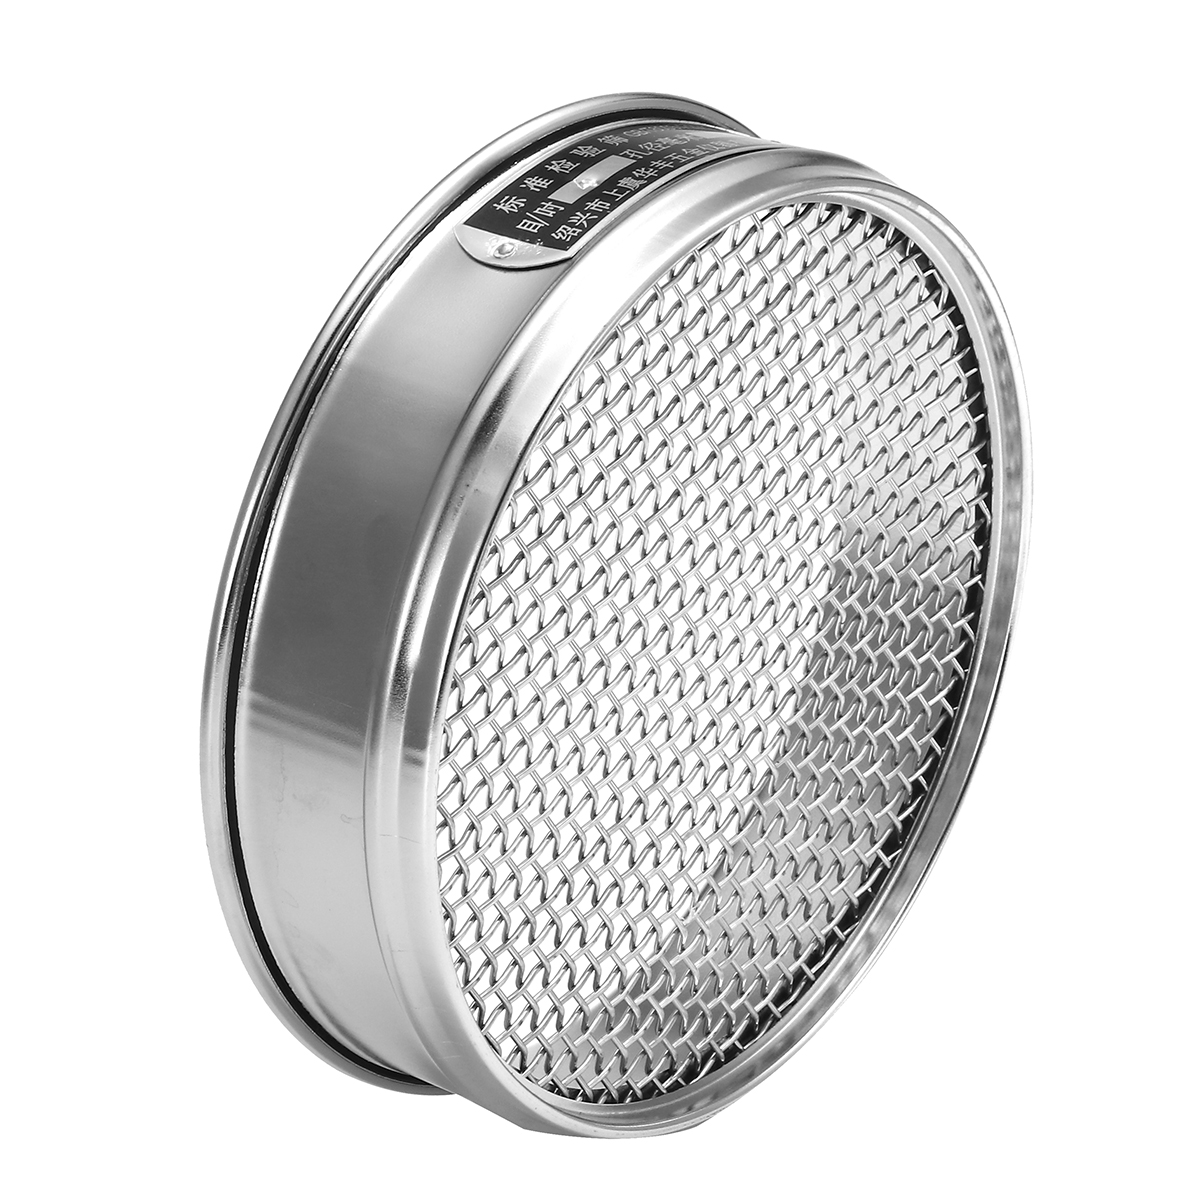
Sieve correlation involves the use of an industrial sieve as a measurement device. It divides a sample of a known weight amount into fractions using different mesh sizes–which represent the number of openings per unit of area. Larger particles stay on the top, while smaller particles pass through the mesh and move to the next level. This process continues until the smallest particles are collected at the bottom. Sieve correlation assumes that particles are round and that they will make it through the mesh.
Limitations of Sieves and why Dynamic Image Analysis is important (also known as Flow Imaging Microscopy).
One of the significant limitations of sieve analysis is that not all particles are round. Irregular particles can get caught in the previous fraction and can report inaccurate results. Sieve correlation also does not provide high-resolution data, making it challenging to determine the exact size and shape of the particles.
Automated dynamic image analysis is a more accurate and detailed method of particle size analysis. It involves analyzing an image of the particles and using the image to determine the particle size and shape. This process provides a more accurate and detailed result than sieve correlation.
How Automated Dynamic Image Analysis Complements Sieve Correlation
Automated dynamic image analysis is becoming a complementary method to sieve correlation. At Vision Analytical, we have dynamic image analysis systems that correlate to sieves but provide more detailed information. At the beginning of an analysis, users can select all of the fractions or sum of the fractions they want to measure. After measuring all the fractions, the analysis will provide a different mesh size for each fraction.
To demonstrate the benefits of Automated dynamic image analysis, let’s consider an example. A sample of 242 Micron glass beads, 42 Micron glass beads, and 15 Micron garnet is mixed up. Using the dynamic image analysis system, the user can see the equivalent circular diameter and the number-weighted distribution of each fraction.
Interested in Dynamic Image Analysis Solutions?
Automated dynamic image analysis is becoming a complementary method to sieve correlation, providing more accurate and detailed results, and making it a more reliable method of particle size analysis. Sieve correlation still has a place in the industry. Want to learn more? Contact a member of the Vision Analytical team today. If you have found this post interesting and would like to see more videos on dynamic image analysis, click the button below to subscribe to our YouTube channel.


