
Particle Count vs Particle Concentration: What’s the Difference (and Why It Matters)?
If you’ve ever reviewed a particle analysis report and wondered whether you should be focusing on total particle count or particle concentration, you’re not alone.
These two terms sound similar — and they both involve “counting particles” — but they answer very different questions. And depending on your application (hydraulics, lubrication, fuels, pharmaceutical inspection, process water, etc.), choosing the wrong metric can lead to the wrong conclusions. Particle concentration is one of the most widely used metrics in contamination monitoring, fluid cleanliness testing, and pharmaceutical particle analysis.
In this article, we’ll break down the difference between total particle count and particle concentration, explain when each should be used, and show how particle concentration becomes especially important when you want consistent, comparable results.
What Is Total Particle Count?
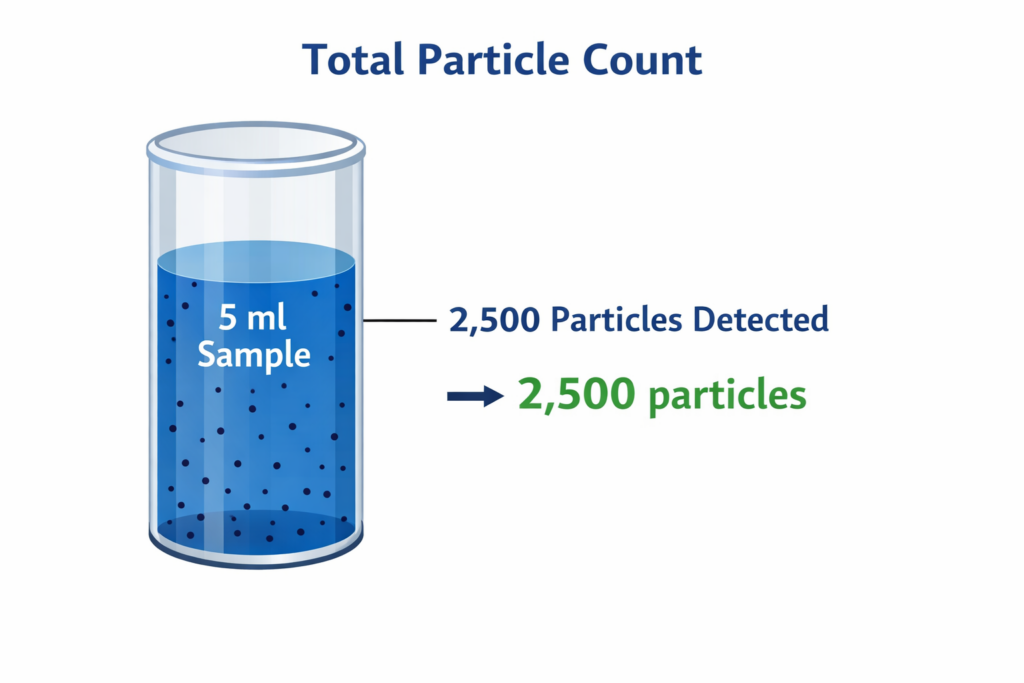
Total particle count is the absolute number of particles detected in the sample volume that was analyzed.
In other words, it answers the question:
“How many particles were found overall?”
Example
If an instrument analyzes 5 mL of hydraulic fluid and detects 2,500 particles, then:
-
Total particle count = 2,500 particles
That’s it — no normalization, no correction for volume, no scaling.
When Total Particle Count Makes Sense
Total particle count is most useful when:
-
The sample volume is fixed
-
You care about total contamination load in a single container
-
The sample itself is a discrete product (like a vial, syringe, or filter rinse)
This is why total particle count is common in certain inspection workflows, especially in pharmaceutical and medical product testing.
What Is Particle Concentration?
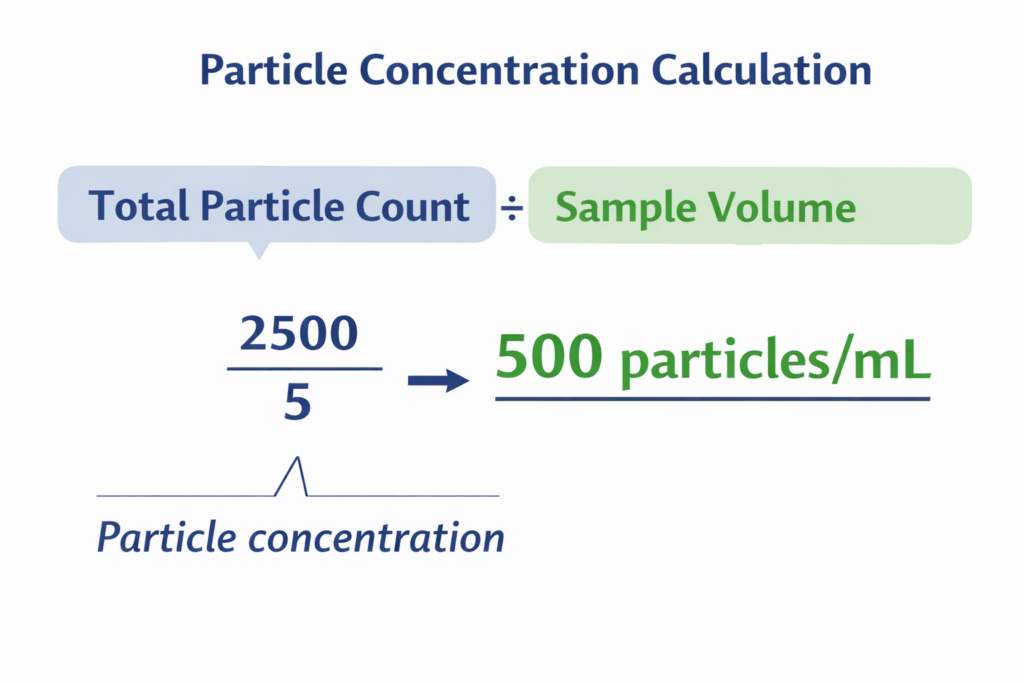
Particle concentration is the number of particles per unit volume and is calculated by dividing the number of detected particles by the volume of the sample analyzed.
It answers the question:
“How contaminated is the sample per mL (or per liter)?”
This is the more widely applicable metric when you need to compare different samples fairly.
Example
If 2,500 particles are detected in 5 mL:
So the concentration is:
-
500 particles/mL
Why Concentration Matters
Particle concentration is powerful because it lets you compare results even when:
-
Sample volume changes
-
Sampling procedures differ slightly
-
Different systems produce different sample sizes
-
You want to trend contamination over time
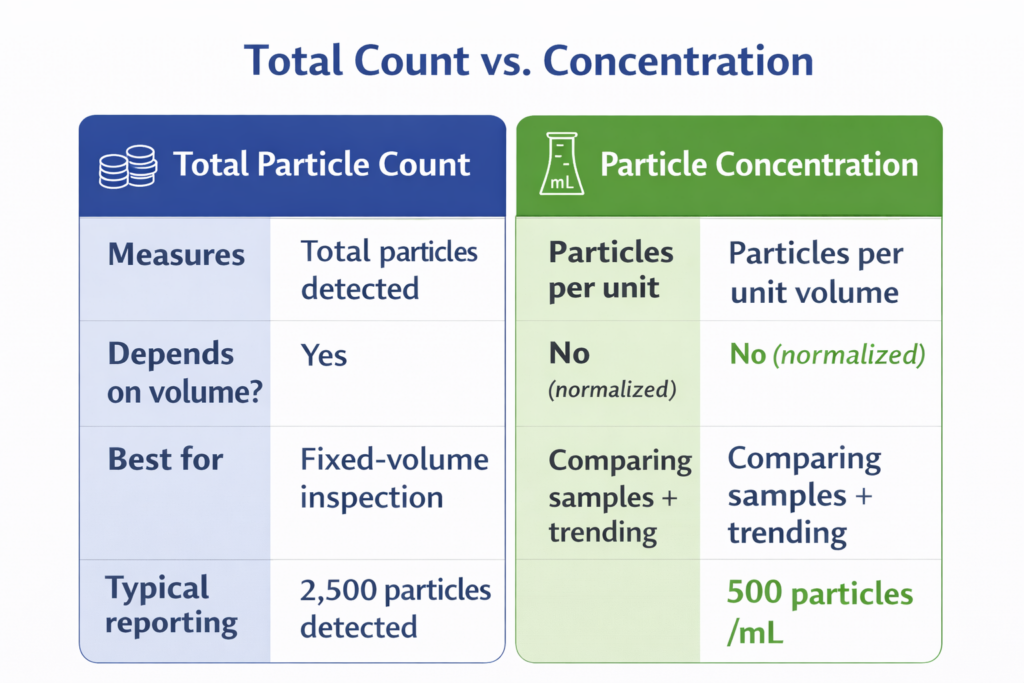
Total Count vs Concentration: A Quick Comparison
Here’s the simplest way to think about it:
-
Total particle count tells you how many particles were found
-
Particle concentration tells you how contaminated the fluid is
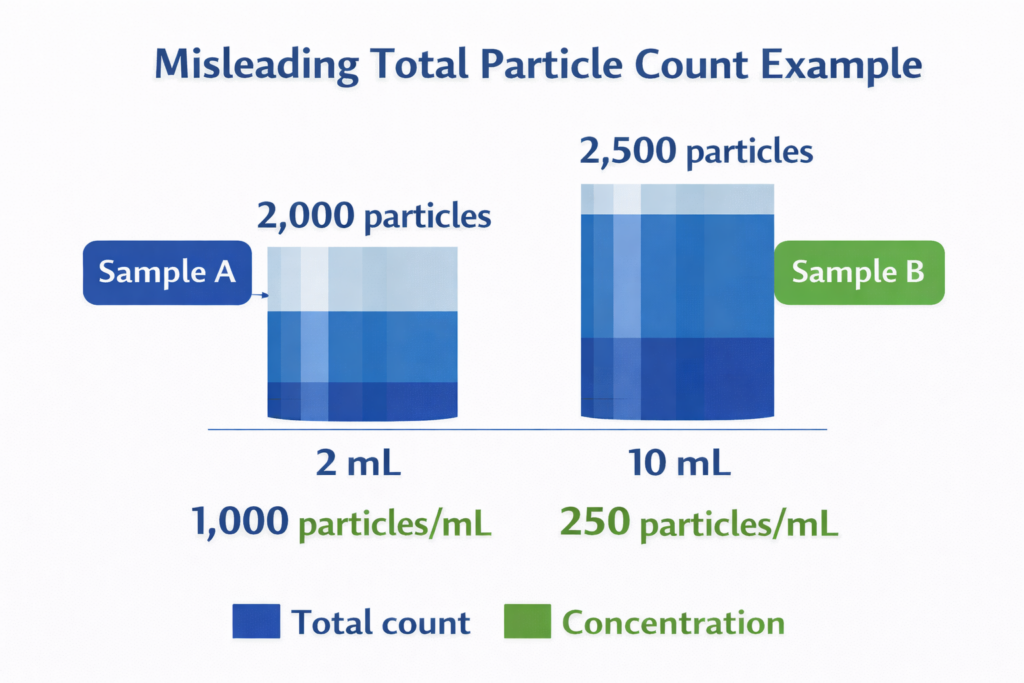
A Common Mistake: Total Count Can Mislead You
Here’s where things get tricky.
Total count sounds like the most direct measure — but it can be misleading when sample volume changes.
Example
-
Sample A: 2,000 particles in 2 mL
-
Sample B: 2,500 particles in 10 mL
At first glance, Sample B looks worse because 2,500 > 2,000.
But concentration tells a different story:
-
Sample A: 2,000 ÷ 2 = 1,000 particles/mL
-
Sample B: 2,500 ÷ 10 = 250 particles/mL
So Sample A is actually 4× more contaminated, even though its total particle count is lower.
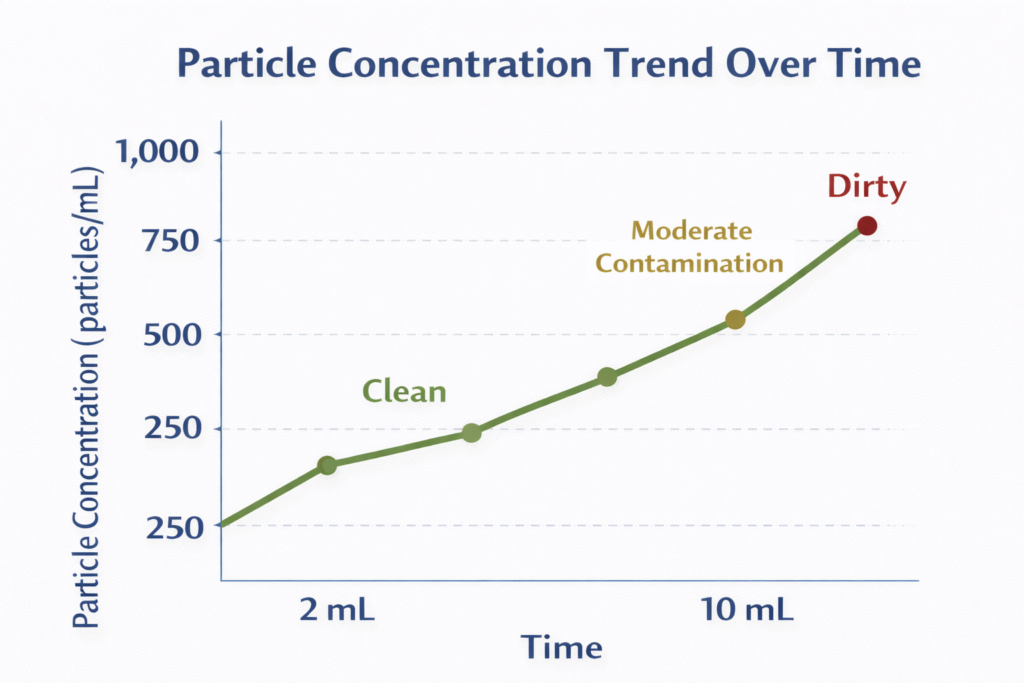
Why Particle Concentration Is the Standard for Fluids
In most fluid monitoring applications — from hydraulics, lubrication, fuels, or injectable therapeutics — particle concentration is the preferred measurement because it aligns with real-world decision-making:
-
Is the system getting cleaner or dirtier over time?
-
Is contamination increasing after a maintenance event?
-
Are filtration changes improving cleanliness?
-
Is a machine trending toward failure?
Those questions require measurements that are:
-
repeatable
-
comparable
-
normalized
That’s exactly what concentration provides.
Particle Concentration and ISO Cleanliness Reporting
Many cleanliness classification systems are built around concentration-style reporting, where particle counts are normalized to a standard volume.
That includes common contamination monitoring approaches in:
-
hydraulic systems
-
lubrication oil monitoring
-
fuel cleanliness monitoring
This is one reason why particle concentration is often more actionable than total count in reliability programs.
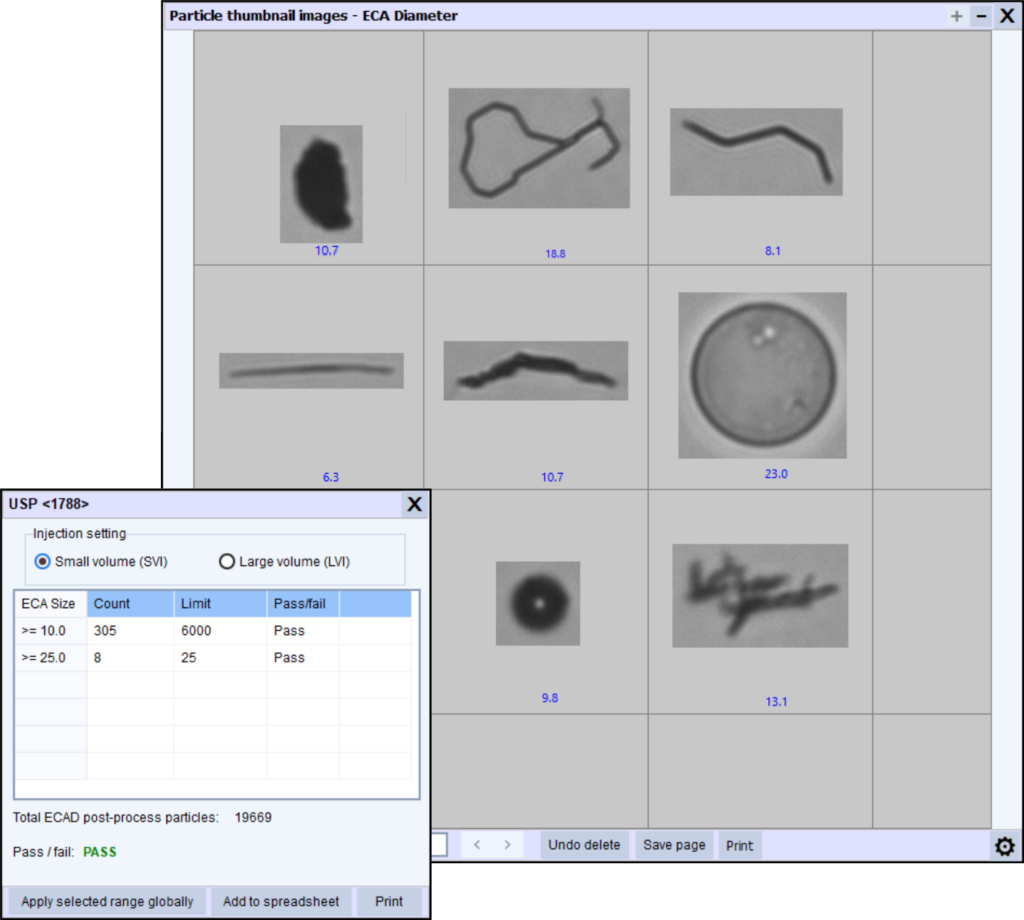
Particle Concentration in Biopharmaceutical Testing: USP <1788>
Particle concentration reporting is not limited to industrial fluids. It is also central to biopharmaceutical quality control, where particle measurements help ensure the safety and quality of injectable therapeutics.
One example is USP <1788>, which addresses the characterization of subvisible particles in therapeutic protein injections. Unlike traditional particle counting methods that only report particle size and count, USP <1788> recognizes the importance of understanding particle morphology and composition.
This is especially important because particles in biologic drugs can originate from multiple sources, including:
-
Protein aggregation
-
Silicone oil droplets from syringes
-
Glass delamination
-
Environmental contamination
-
Manufacturing residues
Simply knowing the number of particles is often not sufficient. Understanding what those particles actually are can be critical to identifying root causes and ensuring product safety.
Moving Beyond Counting: Particle Imaging and Morphology
USP <1788> highlights the value of analytical methods that can provide additional characterization of particles, not just counts.
This includes techniques capable of measuring:
-
Particle size distribution
-
Particle concentration
-
Particle morphology (shape characteristics)
-
Particle transparency or opacity
These additional data layers help scientists distinguish between different types of particles, such as:
-
protein aggregates
-
silicone droplets
-
fibers
-
crystalline particles
-
metallic contaminants
By combining particle concentration measurements with particle imaging, analysts gain a much clearer understanding of the contamination source.
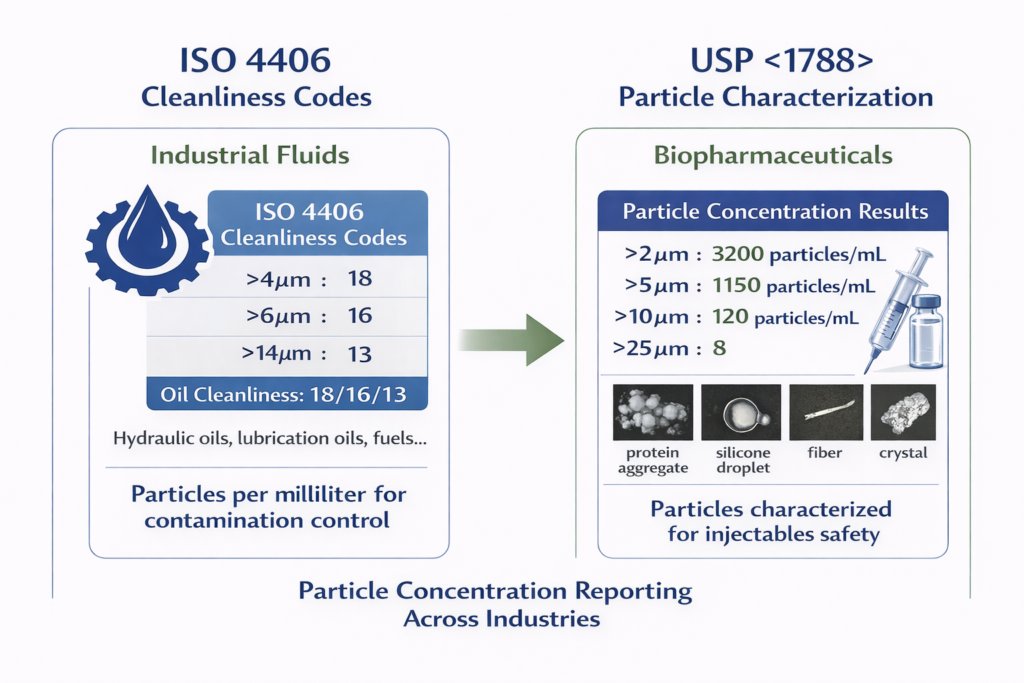
A Shared Measurement Principle Across Industries
Although ISO 4406 and USP <1788> serve very different industries, they both depend on the same foundational measurement principle:
Particles must be counted relative to a known sample volume.
This ensures that particle measurements are:
-
reproducible
-
comparable across instruments and laboratories
-
meaningful for trending and quality control
Whether the goal is:
-
monitoring contamination in hydraulic oil, or
-
characterizing particles in biopharmaceutical formulations,
particle concentration remains the core measurement that enables reliable analysis.
Why This Matters
Standards such as ISO 4406 and USP <1788> demonstrate that particle concentration is not just a convenient reporting format — it is a critical foundation for contamination monitoring across industries.
When particle concentration measurements are combined with particle imaging and morphology analysis, they provide a deeper level of insight that can significantly improve troubleshooting, product safety, and process understanding.
Where Particle Concentration Measurement Is Headed
As contamination monitoring evolves, more users are looking beyond a simple particle number and asking deeper questions like:
-
What type of contamination is it?
-
Are the particles metallic, fibrous, or crystalline?
-
Is the contamination coming from wear, ingress, or process residue?
-
What is the particle shape distribution?
This is where modern particle measurement tools can add value — especially when particle concentration measurement is paired with particle imaging, allowing you to validate what the particles actually look like.
Bringing It All Together
If you’re trying to decide whether to focus on total particle count or particle concentration, the rule of thumb is simple:
Choose Total Particle Count when:
-
You are measuring a fixed, standardized sample volume
-
You are inspecting discrete items (vials, syringes, filters, rinse tests)
-
The total number in the container is the main concern
Choose Particle Concentration when:
-
You want to compare results between samples
-
Sample volumes may vary
-
You want to trend contamination over time
-
You are monitoring hydraulic fluids, lubricants, fuels, or process fluids
Key Takeaway: Particle Count vs Particle Concentration
Total particle count tells you how many particles were detected. Particle concentration tells you how contaminated the sample is per unit volume — and it’s usually the better metric for fluid monitoring and decision-making.
If your work involves monitoring contamination in hydraulic fluids, lubricants, or fuels, it’s worth using an approach that delivers repeatable particle concentration results — ideally with the ability to validate contamination type through particle imaging.
FAQ: Particle Count vs Particle Concentration
Frequently Asked Questions About Particle Counting and Particle Concentration
What is particle concentration?
Particle concentration is the number of particles per unit volume of a sample. It is typically reported in units such as particles per milliliter (particles/mL) or particles per liter (particles/L).
Unlike total particle count, which simply reports how many particles were detected, particle concentration normalizes the count relative to the sample volume. This allows measurements to be compared across different samples and testing conditions.
How is particle concentration calculated?
Particle concentration is calculated by dividing the total number of particles detected by the volume of the sample analyzed.
Example:
Total particles detected: 2,500
Sample volume analyzed: 5 mL
Particle concentration:
This normalization allows results to be compared between different samples or testing methods.
What is the difference between particle count and particle concentration?
The difference is simple:
- Total particle count = the total number of particles detected in a sample
-
Particle concentration = the number of particles per unit volume
Total particle count depends on the sample volume analyzed, while particle concentration provides a normalized measurement that allows results to be compared between different samples.
Why do many standards use particle concentration instead of total count?
Many contamination monitoring standards rely on particle concentration because it provides consistent and comparable results.
For example:
- ISO 4406 reports cleanliness levels based on particle concentration ranges in hydraulic fluids and fuels.
-
USP <1788> uses particle concentration measurements to help characterize subvisible particles in biopharmaceutical formulations.
By normalizing particle measurements to a known volume, these standards ensure that results are reproducible and meaningful across different laboratories and measurement systems.
Why is particle concentration important in contamination monitoring?
Particle concentration is important because it allows users to track contamination levels over time.
In systems such as hydraulic machinery, lubrication circuits, and fuel systems, increasing particle concentration can indicate:
- equipment wear
-
filtration problems
-
external contamination
-
fluid degradation
Trending particle concentration measurements can help identify problems before they lead to equipment failure.
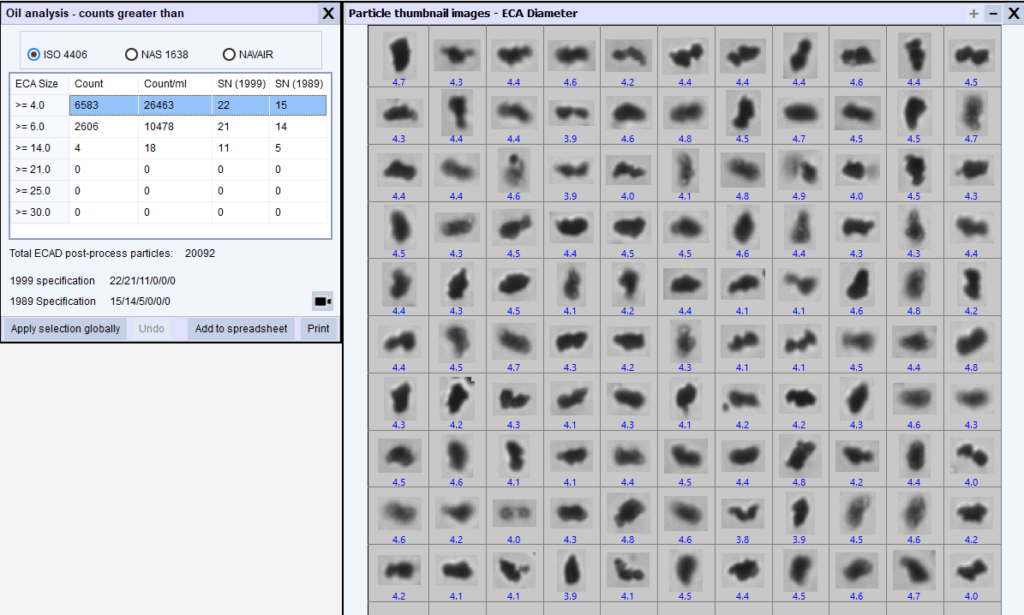
Can particle concentration measurements also identify particle types?
Traditional particle counters measure only particle size and concentration, but newer techniques can provide additional information about the particles themselves.
Methods such as Dynamic Image Analysis (DIA) can measure particle concentration while also capturing images of individual particles, allowing users to evaluate particle shape and potentially identify contamination sources.
This added information can be especially valuable in applications such as contamination monitoring and pharmaceutical particle characterization.
Learn More About Particle Concentration Measurement
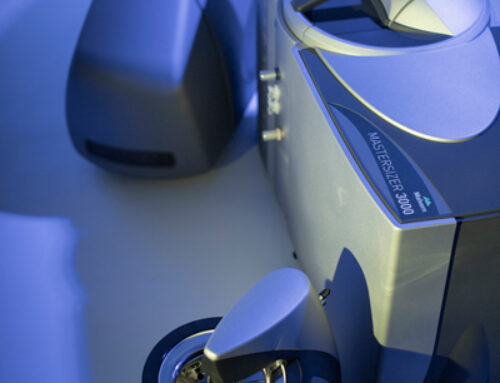
If particle concentration measurement is important to your application, modern particle analysis systems can provide much more than just counts. Today’s technologies can measure particle size, concentration, and morphology, helping users understand not only how many particles are present, but also what those particles actually are.
At Vision Analytical, our Raptor systems use Dynamic Image Analysis (DIA) to measure particle concentration while also capturing images of the particles themselves. This allows users to verify contamination sources and gain deeper insight into their samples.
Depending on your application, different Raptor systems are optimized for different measurement environments.
Particle Analysis for Biopharmaceutical Applications
For laboratories working with injectable drugs, biologics, and protein formulations, particle characterization plays an important role in understanding subvisible particles and ensuring product safety.
The Raptor 1788 is designed to support particle analysis workflows aligned with USP <1788> guidance, providing particle concentration measurements along with particle imaging and morphology analysis.
Learn more about the system here:
➡ Raptor 1788 – Particle Analysis for Biopharmaceutical Applications
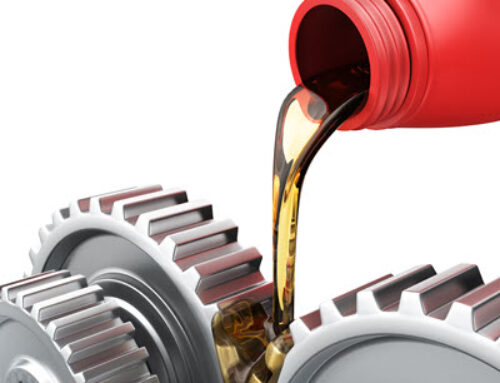
Particle Concentration Monitoring for Fuel and Lubrication Systems
In hydraulic systems, lubrication systems, and fuels, particle contamination can directly impact equipment reliability and maintenance costs.
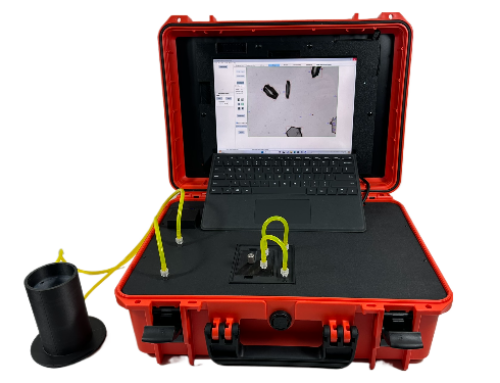
The Raptor Portable system is designed for contamination monitoring in fluids, helping users measure particle concentration and analyze particle shape to better understand contamination sources.
Learn more about this system here:
➡ Raptor Portable – Particle Contamination Monitoring for Fuel and Lubrication
Want to Learn More About Dynamic Image Analysis?
Dynamic Image Analysis is a powerful particle measurement technique that combines particle counting with particle imaging, providing valuable insights into particle size, shape, and concentration.
To learn more about how Dynamic Image Analysis works and where it is used, explore additional educational resources on ParticleShape.com.
👉 Reach out here: Contact Vision Analytical

