Adapting Dynamic Image Analysis to Online Processes :
Examples in Crystallization
Abstract
This white paper is an overview of how to adapt dynamic image analysis, typically a lab only or portable analysis equipment, to online or in process use. Historically particle size analysis adapted to online needs have required lower quality resolution due to the technical nature of these historical techniques. The simplicity of dynamic image analysis lends itself not only to having very high resolution but also to enable the same resolution and keep ability to be adapted to in process required applications. The result of adapting dynamic image analysis to in-process applications is to give end users more information than just particle size. Dynamic image analysis can give similar size information as well as many shape parameters for every measured particle. Being a number-based technique also enables concentration and counts of different particle types making this ideal four live in process analysis of raw material particles.
Disclaimer
The opinions, findings and conclusions expressed in this publication are those of the authors who are responsible for the facts and accuracy of the data presented herein. This report does not constitute a standard, specification or regulation. Authors reserve the right to modify and change this document at any time for the purposes of clarity and corrections.
1. Introduction
Measuring particle size is a very common activity done to ensure raw materials are in the state of where they should be. Many users measure particle size to ensure raw material flowability, compressibility, and even their surface area is adequate for their product. It is very common to have particle size analyzers in laboratories where raw particles or powders are used for an end product. Of course, the most common particle size methods assume particles are round Requiring some expertise to interpret data in these general laboratories.
Having these analysis tools in the general laboratory sometimes is not ideal given the amount of time it takes for a sample to be taken from the process, walked over to the laboratory, and analyzed for interpretation. Sometimes this delay in time identifying a problem with your raw materials can cost significant amounts of money. Because of this, for many years industries have tried to push manufacturers of equipment to adapt these particle size instruments to be at-line or online to obtain immediate results so operators can take immediate action. Unfortunately, typical particle size analyzers are not ideal for at line or online adaptation. Over the past, some techniques have been adapted to an online process but with much lower resolution than the laboratory-based counterparts. Users have had to adapt and accept this lower level of resolution. Also, because particle size only techniques we’ll assume all particles are around, online adaptation also limits the information given to the end user. For example, an air bubble, a particle contamination, or a real particle can all be the same size and the end user would never know until it’s too late.
A relatively new technique, dynamic image analysis, has emerged in the past 20 years because of faster processing speeds of computers and improvements in camera sensor technology. As of recent years, dynamic image analysis has become much more popular and well known in the particle analysis industry. The reason for such a quick adaptation is the amount of additional information this technique offers over just particle size. Dynamic image analysis does give particle size results but also gives particle shape results of every measured particle. Because dynamic image analysis is a number-based technique, it also enables particle counting and no minimum concentration requirement. This means dynamic image analysis has the ability of detecting rare events such as contamination as well as determining what percentage, or count, of different particle classes there are in your sample. For example, dynamic image analysis can tell the difference between an air bubble, a particle contamination, or a real particle. It can also tell you how many and what percentage each represents of the total sample.
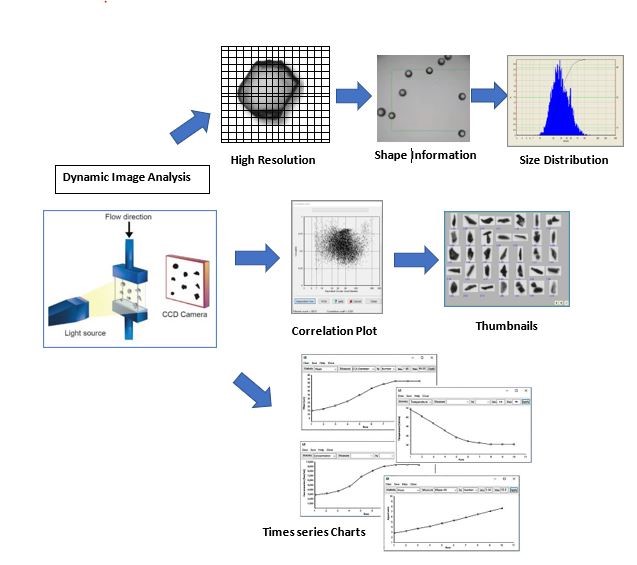
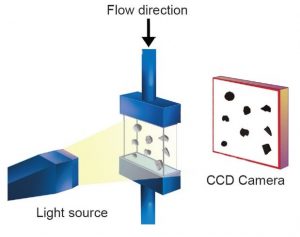
Dynamic image analysis uses a camera to take images of particles as they flow. Because of the simplicity of this technique, it makes it very easy to adapt to an in process required application with any decrease in data quality. Therefore, for the first time, the resolution, accuracy and precision of a laboratory-based instrument can be replicated online. Because many shape measurements are made of every detected particle, dynamic image analysis gives the user the ability to identify and classify every population of particle in their sample. In addition, dynamic image analysis will give particle thumbnails of every measured particle. All of this additional information as well as thumbnail images reduces the need for an expert to analyze statistics as is required for size-only techniques. Dynamic image analysis equipment is also not as sensitive to temperature variations as other size only techniques are.
2. Size Only Measurements VS Shape Measurements
Popular particle analysis equipment supplies size-only data which may be accurate if all your particles are round. Obviously, for most industrial samples this is not the case, particularly when it involves crystal growth. Cord length measurements which are usually found with in-process probe-based equipment will measure particles as they enter and exit the measurement zone. These focused laser beams can experience optical differences within the particle that, yet again, can give incorrect measurements if particles are crystalline in nature.
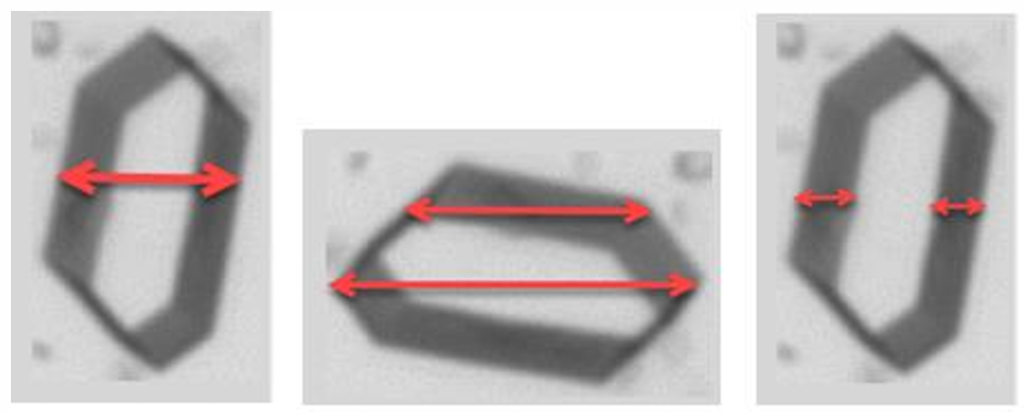
In the example below, a cord length of this crystal can be one size if the particle crosses the focused beam one way and if the crystal enters the detection zone in a different direction it will be a vastly different length. Cord-length equipment will take the length and report a result that assumes this particle is round. Which is correct?
In some instances, the refractive index difference of the carrier fluid versus the translucence of crystal particles can have adverse effects on rendered size values where just the particle’s crystal edges are measured.
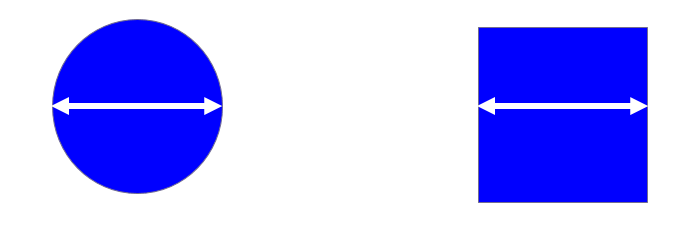
Oter size-only techniques use indirect measurements. This means that the actual size of the particle is not being measured but rather some physical phenomenon related to particle size is being measured. All these techniques, again, will report particle size assuming all particles are around. As can be seen in the example below, these two pictures have the same cross-sectional with. However, as one can imagine, in a process the round particles would flow and compress much easier than the square particle. The round particle can also be an air bubble or oil droplet that would be reported the same as the square particle. These size only techniques are limited but they still offer some type of feedback in process which is good.
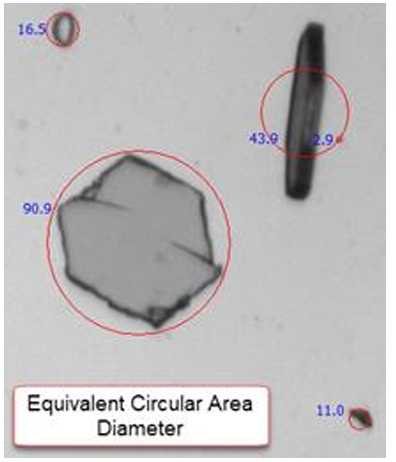
As mentioned earlier in this document, dynamic image analysis uses a high-speed camera to take particles as they flow. This allows for a large number of particles to be analyze in a short amount of time. This increases representative sampling and will increase the probability of capturing any out of specification sample particles. Dynamic image analysis systems also try to ensure proper sample dispersion. The fluidic techniques used to properly disperse samples are important to ensure particles do not overlap which can lead to incorrect measurements. Images are gathered and calculations on individual particles are performed in real-time. Possessing more than just the size supplies the operator with more information about their process and how it is evolving over temperature and time. An actual Dynamic image analysis image that shows what a size-only measurement would calculate is shown below.
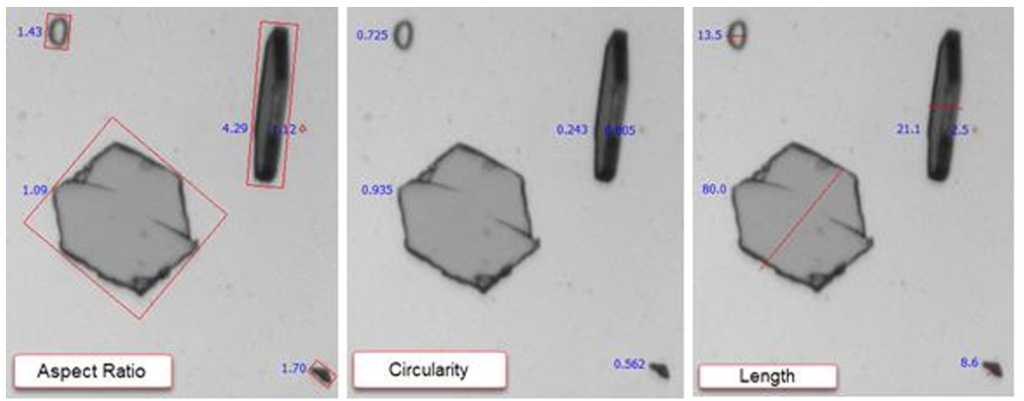
As can be observed in this image, assuming all particles are round can supply misleading data which can result in false determinations about the process and result in scrap or waste of materials. Below, the additional shape information for each of the thumbnail images can be observed. Dynamic image analysis does an outstanding job of gathering exact quantitative information. It also quickly supplies confirmation thumbnails images or tens of thousands of particles. This allows the user to monitor shape over time vs temperature and concentration Without the need of an expert to interpret data.
In-process operations require more immediate and detailed feedback to make the correct decisions. In-line measurements are sometimes probe-based and usually provide extremely limited data such as the cord length of the limited number of particles it can distinguish in the sample. Data from probe-based instruments are negatively affected by concentration, and due to lack of particle dispersion, gathering accurate data is difficult. Probe-based instruments report the counted number of measured particles, but this is not a true indicator of particle concentration in the reactor. So, most probe-based particle measurement systems are usually employed for qualitative information not quantitative data.
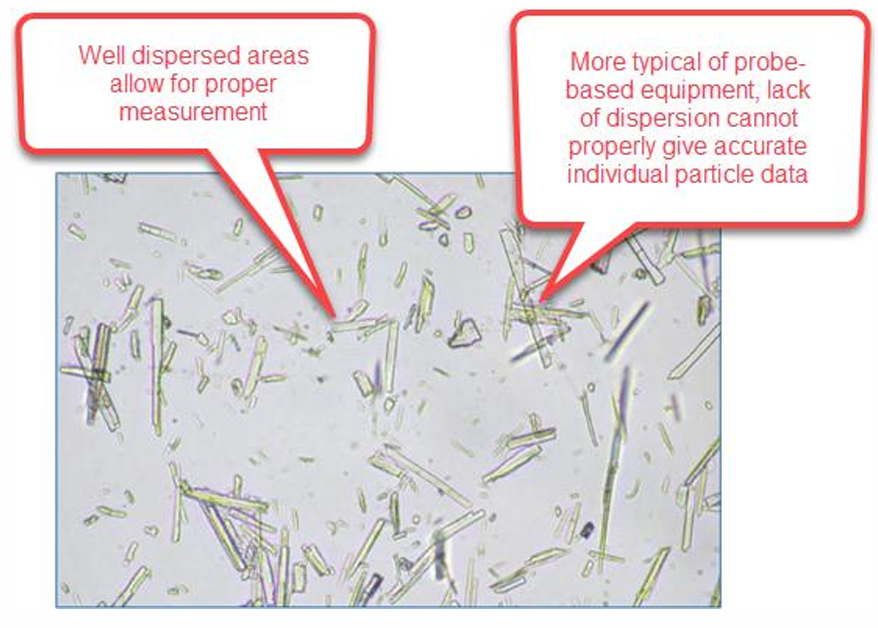
The below figure is shown as a representation of how crucial it is to ensure proper particle dispersion to accurately measure particles. Areas of particles which are grouped cannot properly measure individual particle data and can be misleading to those monitoring the process when reported
Dynamic Imaging systems will typically use a sealed on-line measurement where a milliliter sized aliquot is continuously drawn, analyzed, and returned to the reactor with no ambient contact. Proper tubing and low dead volume capabilities make sure that there are no temperature alterations from when the sample is extracted to the few seconds when it is returned. The flow architecture is designed to ensure the correct particle dispersion for accurate and discrete measurement of particles and accurate concentration measurements, i.e. particles per measured volume, not only particle count.
3. Additional Benefits of Dynamic Image Analysis
Time Studies of Size, Shape, Concentration, Temperature
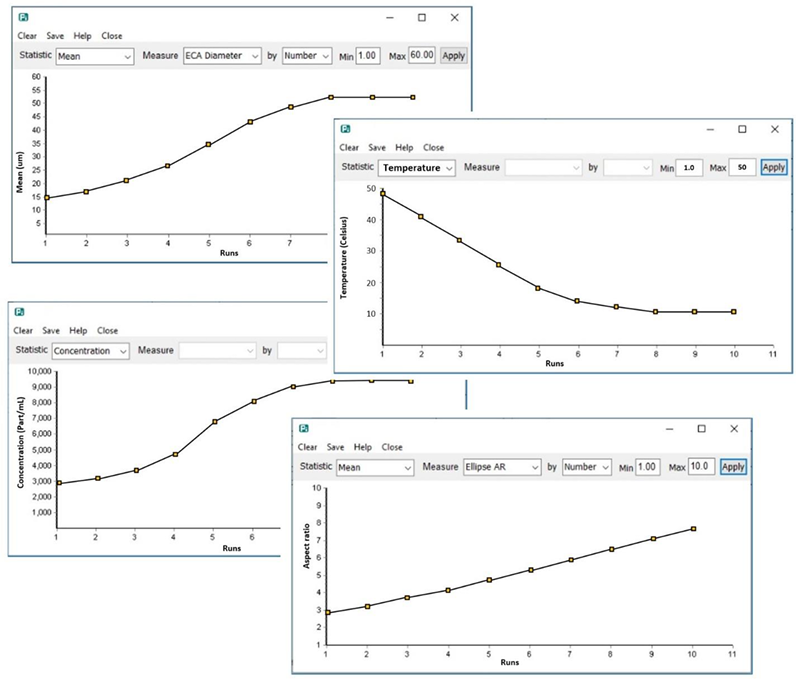
To understand in-process changes in particles as changes in temperature are made, real-time automatic particle analysis overtime is needed. The Particle Insight series of instruments are designed to capture particle shape, size, and concentration of particles over time and as temperature alterations are happening in the reaction
vessel. Data is trended in real-time and plotted in a chart, individual statistics and thumbnail images of each measured particle can be recalled and reviewed.
Below charts reflect the changes in statistics and measures over time.
Identification and Confirmation of Events Throughout the Process
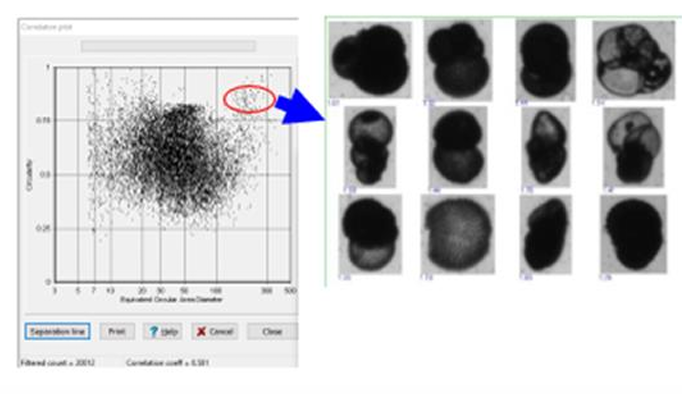
Users can review the many individual analyses performed after trending a process from beginning to end. This enables the user to identify if there are any rare events by utilizing a Correlation Plot and gathering confirmation of each particle by a thumbnail image.
The unique adaptation of this high-resolution, real-time technique to on-line use enables users to obtain more detailed information about their process allowing them to make more accurate decisions regarding their samples. Vision Analytical is focused on Dynamic Image Analysis as its core technology and continuously improving and applying it to meet the challenging needs of many market sectors.
4. Conclusions
With new techniques coming into the market, industry has come to understand the value of Dynamic Image Analysis. Not only does Dynamic Image Analysis give high resolution traditional size information, it also gives extensive shape information. This added feature, along with images of all measured particles, allows end users to have high resolution process change information as well as the ability to differentiate different populations in a sample, such as what percentage of an Active Pharmaceutical Ingredient (API) vs what percentage of excipient is in a sample. Dynamic Image analysis has also been adapted to an on-line process tool and allows to see real-time process changes and track parameters over time such as size, aspect ratio, concentration, temperature changes and other measurements as they happen, using the Time Series Chart feature.


