
Most established particle size techniques assume all particles are round. In reality, most industrial particles are not — leaving critical information unmeasured.
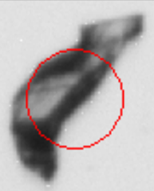
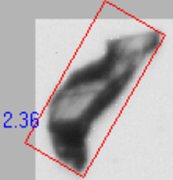
For decades, particle size has been the primary metric for characterizing particulate materials. However, most traditional sizing techniques are indirect and assume that all particles are spherical. In reality, the majority of industrial particles are irregular in shape, introducing uncertainty into size-only measurements. Because of this, relying solely on particle size often provides an incomplete understanding of how materials will behave in real-world applications. As an example, this abrasive particle, being represented as a round particle, would lead one to believe that this is a 100.1 µm particle.
Particle shape plays a critical role in determining how particles behave. Irregular shapes can significantly influence:
These factors ultimately impact the performance, quality, and efficacy of the final product. As a result, understanding particle shape is essential for accurate material characterization.
Recognizing the importance of shape, scientists began incorporating direct measurement techniques—primarily microscopy—to better understand particle morphology. While microscopy provided valuable qualitative insights, it was limited by its slow, labor-intensive nature and the small number of particles that could be analyzed.
As a result, obtaining statistically meaningful data was often impractical.
Significant progress was made in the early 1990s with the development of improved machine vision cameras and more powerful computing systems. These advancements enabled the analysis of much larger particle populations in a more standardized and quantitative manner.
Image analysis techniques—whether applied to static samples or particles in motion—rely on rapid image capture and processing. This made it possible to measure both particle size and shape with high speed and accuracy.
Commercial particle shape analysis systems began emerging in the 1990s and early 2000s. As a new approach, they initially faced competition from well-established size-only techniques such as laser diffraction.
Like many emerging technologies, widespread adoption required time and industry education. Over the years, awareness increased, and users began to recognize the value of incorporating shape into particle characterization.
Around 2014, shape analysis systems evolved further with the introduction of add-on modules that could be integrated with existing size-only instruments. This positioned particle shape analysis as a complementary technique, enhancing traditional measurements rather than replacing them.
Today, the high resolution and flexibility of image analysis systems have enabled their use across a wide range of applications, including real-time and online particle analysis.
Modern particle shape analysis—particularly through Dynamic Image Analysis—provides a powerful combination of capabilities:
This combination of quantitative data and visual evidence allows users to gain a much deeper understanding of their materials compared to size-only techniques.
Particle shape analysis is a powerful tool for identifying and quantifying components within mixed samples. While particle images provide useful visual confirmation, modern image analysis systems go far beyond simple observation.
By measuring dozens of shape parameters for each individual particle, users can differentiate between materials that may appear similar in size but differ in morphology. This enables the quantification of distinct components within a mixture.
For example, in pharmaceutical applications, shape analysis can be used to determine the percentage of excipients versus active pharmaceutical ingredients in a blend. These measurements can be performed both before and after processing steps, such as mixing or tableting, to ensure consistency and product quality.
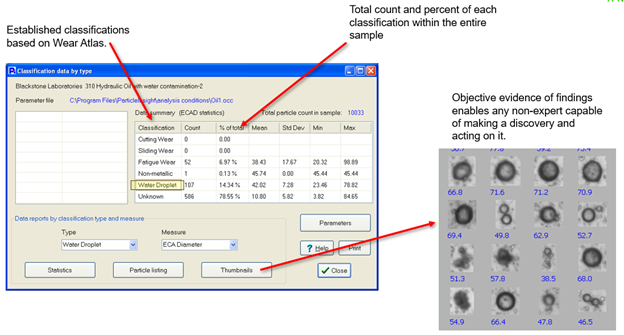
In addition, particle thumbnail images provide objective visual evidence, allowing users to identify anomalies such as agglomerates, contamination, or air bubbles. This combination of quantitative data and visual verification makes particle shape analysis a highly effective tool for both characterization and identification.
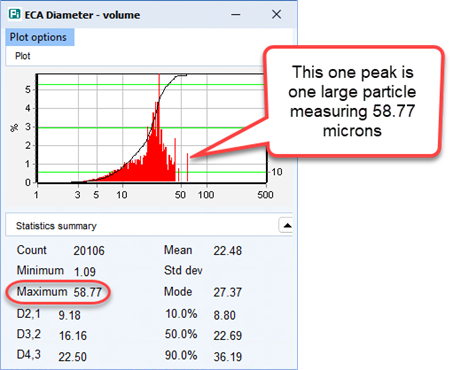
Because Dynamic Image Analysis is a number-based measurement, each particle is measured. This ensures that even ONE particle detected is represented in the statistics and thumbnail images
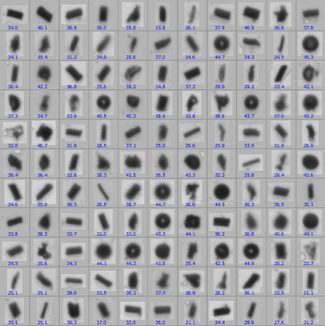
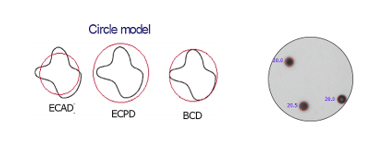
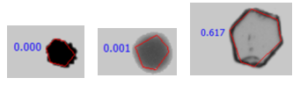
Thumbnails reveal three distinct particle types
For example, when reviewing a particle size distribution alone, an analyst may conclude that all particles fall within a similar size range—such as around 30 microns—with a few unexpected peaks. Interpreting these results often requires expert judgment to determine what is actually occurring within the process.
However, when particle shape is included in the analysis, a much clearer picture emerges. What appears to be a single population based on size alone may, in fact, consist of multiple distinct particle types with different shapes. By incorporating shape data, users can easily differentiate and quantify these populations, eliminating ambiguity and improving confidence in the analysis.
These three different shaped particles all have a size-only measurement of about 35 microns. This is if you’re looking at size-only data. As one can imagine, all these different shapes will blend, compact, flow, and behave differently in a process. This is why additional shape measurements are needed. To identify and quantify the different classes of particles.
As is shown above, dynamic image analysis also gives the user thumbnail images of every measured particle. Besides making 30+ shape measurements of every particle to facilitate differentiating one from the other, the ability to see a thumbnail image as objective evidence eliminates the need for an expert to make a decision based only on a statistical graph and numerical data. In many instances differences in shape, not size, can be used to identify different lots of raw materials. Particle thumbnails help users to detect and identify large particles as either bubbles, agglomerates, or contamination.
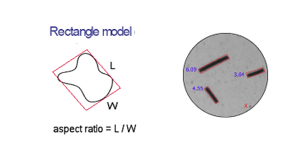
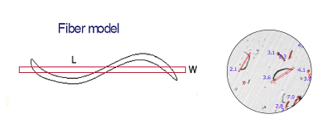
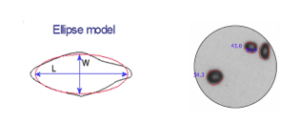
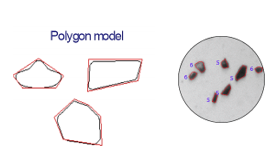
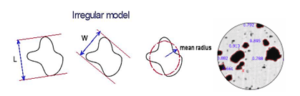
Dynamic Image Analysis provides far more information than particle size alone. In addition to size, it enables the measurement of over 30 different size and shape parameters, typically grouped into multiple shape models. These measurements allow users to fully characterize particle morphology and better understand material behavior.
Not every shape parameter is relevant for every application. Instead, the key is to identify which measurements are most meaningful for a specific material or process.
For example:
By selecting the appropriate shape models, users can monitor the parameters that directly impact product quality and process performance.
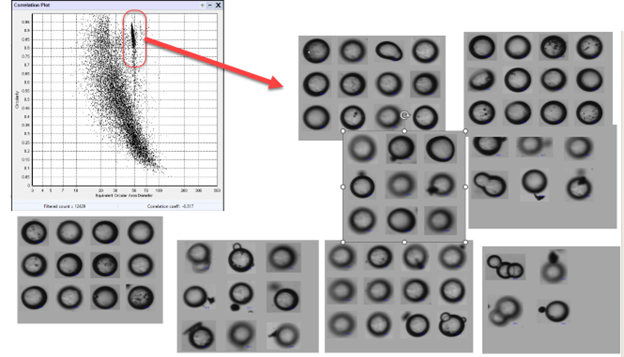
Dynamic Image Analysis also enables correlation between any two measured parameters. This capability allows users to identify rare or outlier particles that may not be visible through size analysis alone, providing deeper insight into sample composition and potential issues.
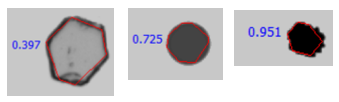
For instance, in a mixture of spherical and rod-like particles, poor flow or compaction may be linked to the relative proportion of these shapes. By tracking the ratio of circular particles (circularity model) to elongated particles (length or aspect ratio models), users can better understand and control material behavior.
Many scientists and users today know how particle shape instrumentation can be used not only as a characterization but also as an identification tool. Regarding characterization, many use shape analysis to quantify the percentage of different particles in a mixed sample. For example, a user can characterize the percent of excipient to active pharmaceutical ingredients after mixing. They can also then perform the exact measurements before tableting.
Shape analysis also allows for the identification of rare events. In some applications it is difficult to identify and quantify contamination particles or agglomerates. With the use of functional correlation plots a user can easily identify these particles of interest and have thumbnail images of them as objective evidence.
While particle size remains an important parameter, it does not fully describe particle behavior—especially for irregularly shaped materials. Different measurement techniques can produce varying results because they rely on different assumptions and physical principles.
By incorporating particle shape analysis, users can:
Particle shape analysis has evolved from a slow, qualitative technique into a fast, quantitative, and highly valuable tool in modern particle characterization. While it is still a growing field, it is now widely recognized as an essential complement to particle size measurement.
By understanding both size and shape, users can make more informed decisions, reduce uncertainty, and achieve better control over their materials and processes.
Click here to see this article is also available on → AZoM.com