Basics of Particle Characterization
Particle characterization is the process of analyzing particles by particle shape, size, surface properties, charge properties, mechanical properties, microstructure and many more measurement parameters. There is a broad range of commercially available particle characterization techniques that can be used to measure particulate samples.
Size and shape are important attributes that affect the behavior of particulate substances. Spherical beads are easily and commonly characterized by a single size measure: “Diameter”. Irregular shapes are more difficult to characterize given their multi-dimensional structure. Powders used in manufacturing, for example, requires several measurement parameters to ensure flowability, packing and other performance functions.
Particle Size and Shape Analysis are analytical techniques by which the distribution of sizes and shapes in a sample of solid or liquid particulate material is measured and reported. Particle size and shape analysis are an important tool in characterizing a wide range of final-product performance for quality control in many different industries, including Paints, Building materials, Pharmaceutical, Food industries and Toners.
Statistical results are generally given with histograms of Because of the large number of particles, size and shape data are statistical. Histograms are the best way to portray statistical distributions of a variable or measure, and there are various means and measures of spread to characterize a distribution using just a few numbers.
Size Distribution histograms
To show the sizes present in a sample, the size range is divided into small size classes or “bins”, and we count the number of particles present in each size bin. The graph below is a size histogram and it presents a good picture of the actual distribution. Size data is normally shown graphically on a log scale axis, to better show the small sizes.

Typical size data histogram
Circularity, Smoothness and Aspect Ratio histograms
Non-size data such as circularity, smoothness or aspect ratio is shown on a linear scale. The more finely the axis is divided, the more accurate will be the means and distribution shape figures that are derived from the histogram. If the divisions are too fine, there may be bins with no counts, and these will show up as gaps in the graph, especially at the low end on a log axis.
In the Particle Insight the number of divisions and the size range are settable in Analysis Conditions.

Typical linear axis histogram
Volume histograms
The volume distribution can be computed accurately only if particles are spherical or if there is accurate shape information. Inferring a volume distribution from single size measure counts will not be accurate if particles are non-spherical.
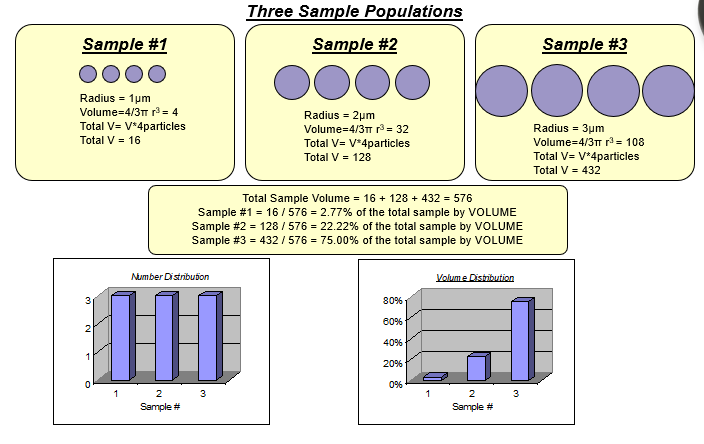
Surface area weighting can be done in a similar way and with the same caveats. On a log scale, a number (unweighted) plot emphasizes the small sizes, while volume weighting emphasizes the large sizes and may not show the smallest sizes at all. Weighting by surface area will be in between number and volume. A volume-weighted histogram plots the relative volumes present in the size classes.

A volume-weighted histogram
Number vs Volume distribution
Results of a particle size measurement requires an understanding of which technique was used and the basis of the calculations. Each technique generates a different result since each measures different physical properties of the sample. The particle size distribution can be calculated based on several models: most often as a number or volume/mass distribution.

Fig. 3 Volume distribution

