Principle of Operation
Particles are suspended in fluid to ensure they are disperse and homogeneous. Then then flow through a flow cell. An illumination source on one side of the flow cell shines light through the cell to a lens and digital camera on the other side. The camera records dark silhouettes of the particles and sends the images to a computer in grayscale format.
The analysis software then analyzes each image in binary format. Various rejection and thresholding parameters are applied and the resulting binary pixelized image is used to calculate the 30+ shape parameters for each particle. At the same time, each particle is saved in a thumbnail format as objective evidence of all the measured particles.


High speed analysis gives high quantity of particles analyzed ensuring representative sampling (“thousands” to “tens of thousands” of particles).
At the end of an analysis, the result give 30+ histograms with all sorts of statistical results and particle thumbnails for all the analyzed particles. All types of exporting this data is also available. Where the true value comes for the customer are the tools available that use all this information to help the end user in ways that other size-only instruments cannot.
Here are some of the value-added benefits of Dynamic Image Analysis:
Counting and Concentration:
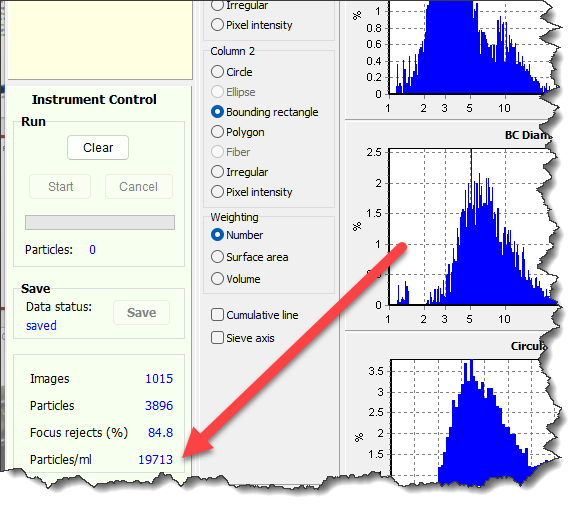
Concentration measurements are given with Dynamic Imaging. Concentration values are displayed in real-time as Particles per milliliter. This is a critical measurement to have available when working with samples that have rare events or when knowing what concentration levels are present for any population or sub-population of samples is needed.
Counting instruments, such as coulter counters and dynamic imaging instruments will also incorporate dilution factors that will take into account and adjust for any pre-dilution of sample.
Volume and Number weighting:
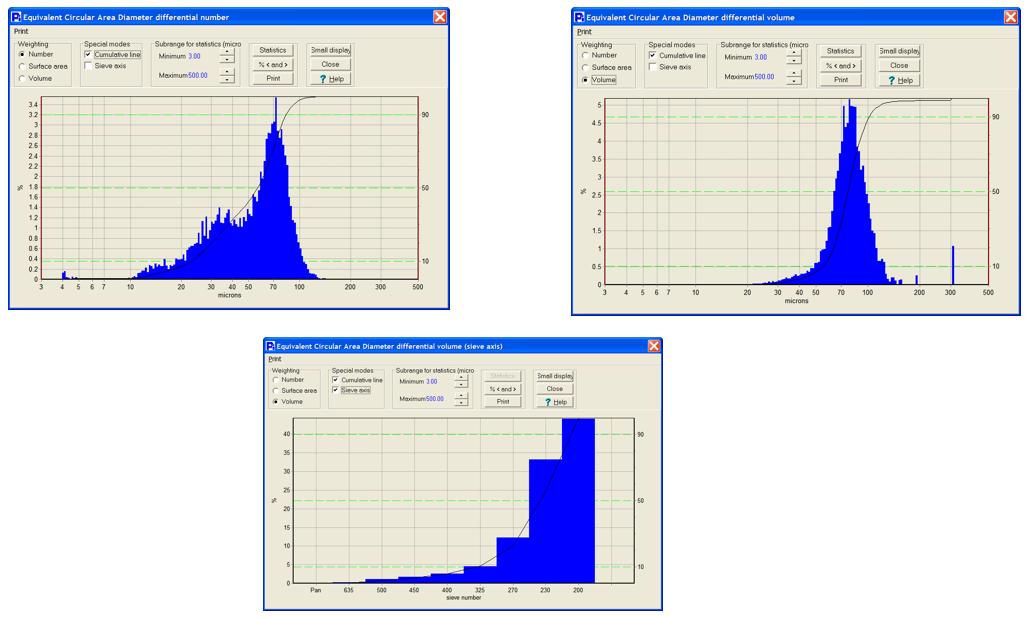
Dynamic imaging, being a counting based measurement, will also enable the reporting of statistical size data as a number weighted and volume weighted distribution. Number weighted distributions are very important to enable visualizing define particles present in a sample. Volume weighted distributions are also very important and enable the visualization of the presence of small amounts of large particles such as agglomerates. Both are always calculated and reported. The ability to also show results as a sieve correlation enables the ability to compare current sieving results to automated dynamic imaging to facilitate transferring methods.
Viewing questionable statistics:
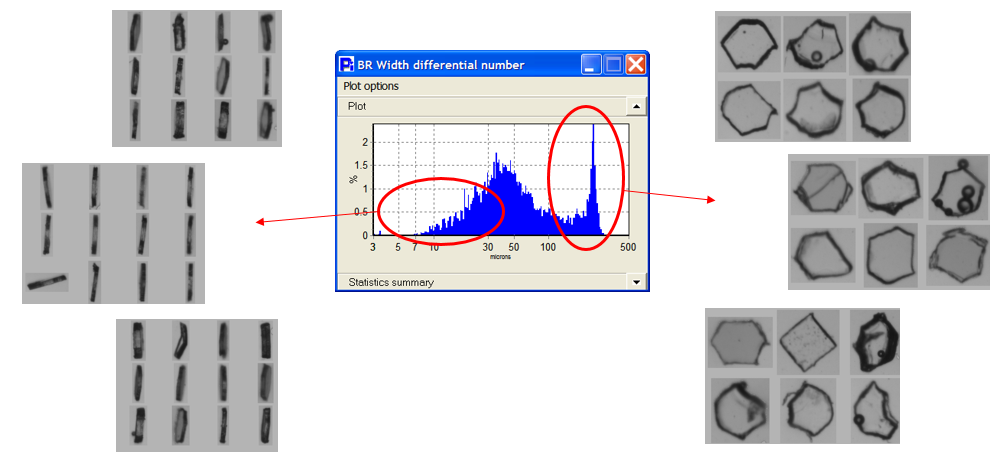
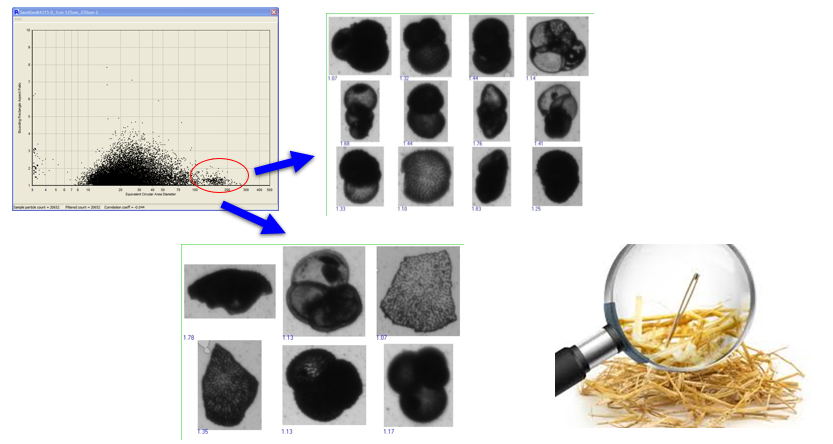
One very important feature of dynamic imaging is the ability to view particles that make up a questionable statistical result. In the image below, size only instruments could render statistical histograms with questionable data without the ability to verify what the data is. Dynamic imaging allows the user to view the particles that make up any area of a size or shape distribution. This offers objective evidence to end users that is only available with dynamic image analysis.
Comparisons:
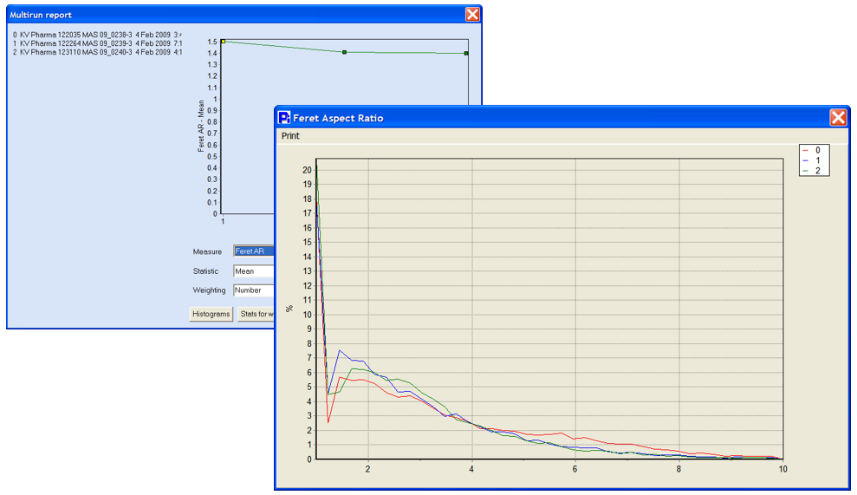
Dynamic imaging allows the end user to compare different lots of samples or different runs of analysis not only by size but also by shape. It is very possible that different samples may not differences in just size, but can have considerable differences in shape.
Correlation plots:
Correlation plots allow customers to have a view of all the analyzed particles with the goal of finding rare events. It would be nearly impossible to identify a particle or set of particles within an analysis of tens of thousands of particles if not for this correlation function. Correlation plots can be created with any two available shape measures.
Classification:
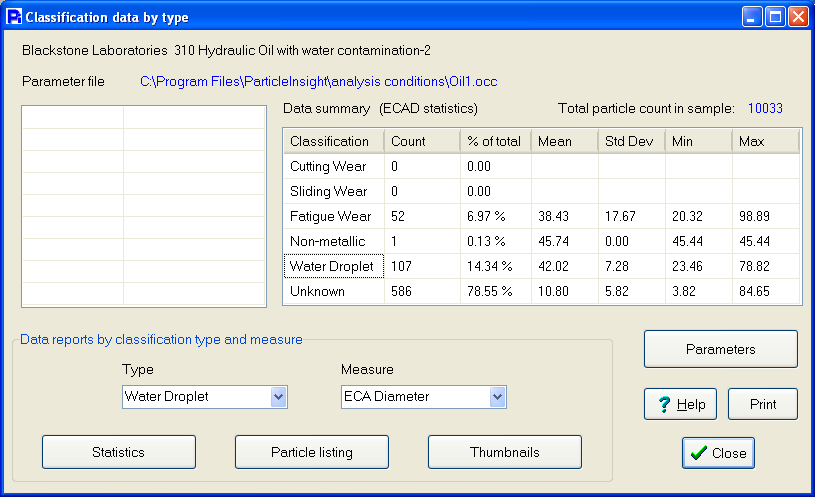
The benefit of having more than 32 shape measurements for every particle enables the software to differentiate each particle from another much easier. When running a multi component sample the fact that every particle has 32 shape measures allows for particle classification. Particle classification is a feature that allows the software to separate and quantify the subpopulations of particles within a sample.
Recirculation Vs Single-pass Analysis
The recirculating fluidic system presents particles for analysis in a random orientation. This is critical to ensure all dimensions of the particles in question are being measured, not just two dimensions. Laser diffraction has employed sample recirculation for 40+ years to ensure a representative analysis of the population.
Recirculating systems allow for re-analysis of the same aliquot. A must for process optimization. Given the dimension of the sensing zone and camera speed, it is highly unlikely to ensure each, and every particle is captured in a single pass. Recirculation ensures full analysis of all particles. Single-pass systems generally use hydro-dynamic focusing that require expensive sheath fluids.
The Insight series of products can be configured to be re-circulating as the standard method of sample suspension, but can also be configured to be single pass if the customer’s application requires it.


