
The challenge
Portland cement is a controlled chemical combination of calcium, silicon, aluminum, iron and small amounts of other ingredients to which gypsum is added in the final grinding process to regulate the setting time. Lime and silica make up about 85% of the mass. Common among the materials used in its manufacture are limestone, shells, chalk combined with shale, clay, slate or blast furnace slag, silica sand, and iron ore.
The strength and setting time of cement is determined by how efficient the chemical reactions between the components are. This in turn is strongly impacted by the particle shapes of the various materials. Predicting the behavior of the end product requires a detailed knowledge of the particle shape makeup.
Traditional non-imaging size analysis instrumentation will report sizes assuming that all particles are round or spherical. Data of that kind may misrepresent the way they will flow in production or perform in their final use.

Typical Size-only result from a commonly used size analyzer |
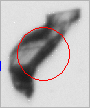 |
This particle represented as “round” would report as “100.1 μm in diameter”. |
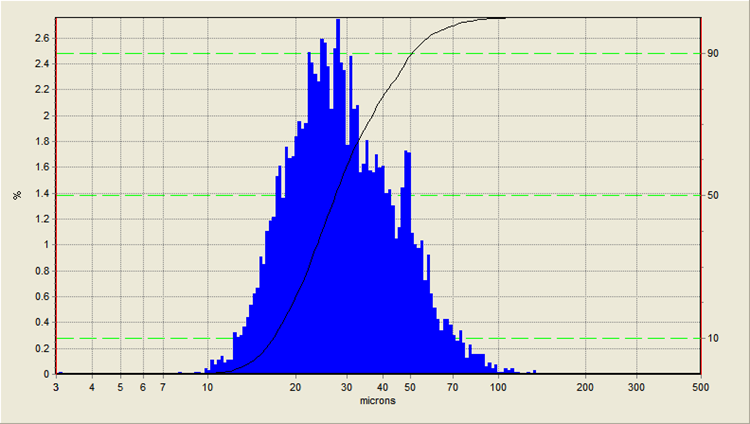
Here we see a typical “diameter” histogram reporting a smooth size distribution centered at about 30µm. |
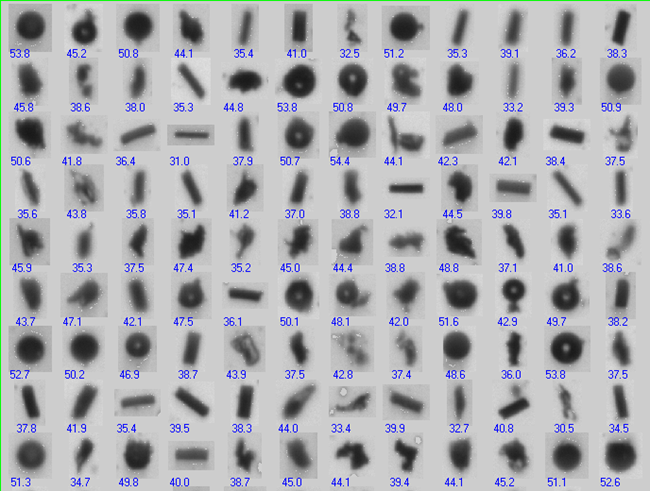
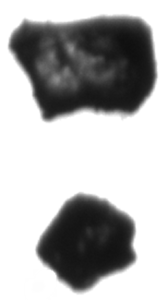
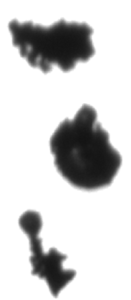
In looking at a sampling of the particle thumbnails, it is obvious that this sample is made up of more than one kind of particle shape. The “diameter” data may mislead the user into thinking the particles are all the same type when they are not. |
The sample contains several types of particle shapes, probably corresponding to the different materials in the mix. The task is to use the power of imaging to characterize the particle subpopulations, in terms of size and shape.
Applicable measures |
Measure
|
Range of acceptance
3 – 3000 microns |
Procedures and Results
The Particle Insight data below shows some of the size and shape results for the Cement sample. These are overall results for the entire sample. 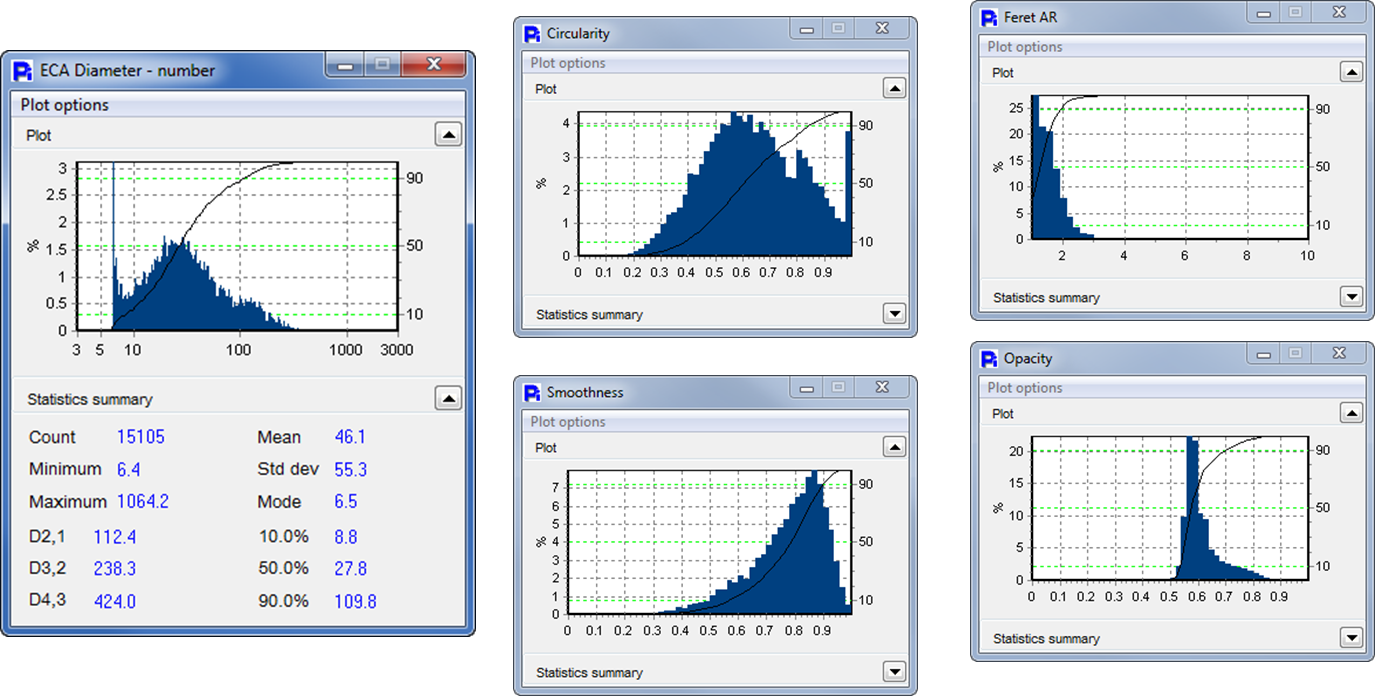
To demonstrate how to use Smoothness to separate out subgroups, let us for simplicity divide the entire sample into a “smooth” classification and a “rough” classification. Looking at the thumbnail particle images, this distinction makes sense; the two subroups are evident. The Smoothness measure should be able to easily separate out these subgroups. In the screenshots below, 0.84 is used as the Smoothness dividing line. The Comprehensive Statistics form displays commonly used means and measures of spread.

Based on a Smoothness greater than 0.84, the smoother particles represented 38.33% of the entire sample. |
 |
 |
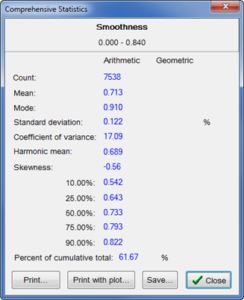
The irregular particles having a Smoothness below 0.84 represented 61.67% of the entire sample. |
In addition to the statistics summary show here, the Particle Insight post-processing utility lets you present the full distribution of any or all of the measures used, for each particle subgroup. You can also view particle thumbnails and 2-measure correlation diagrams.
To analyze only the “very smooth” subgroup, we can place a lower limit of 0.89 on Smoothness in the post-run processing utility.

To analyze only the “very rough” subgroup, a lower limit of 0.60 on Smoothness can be used:

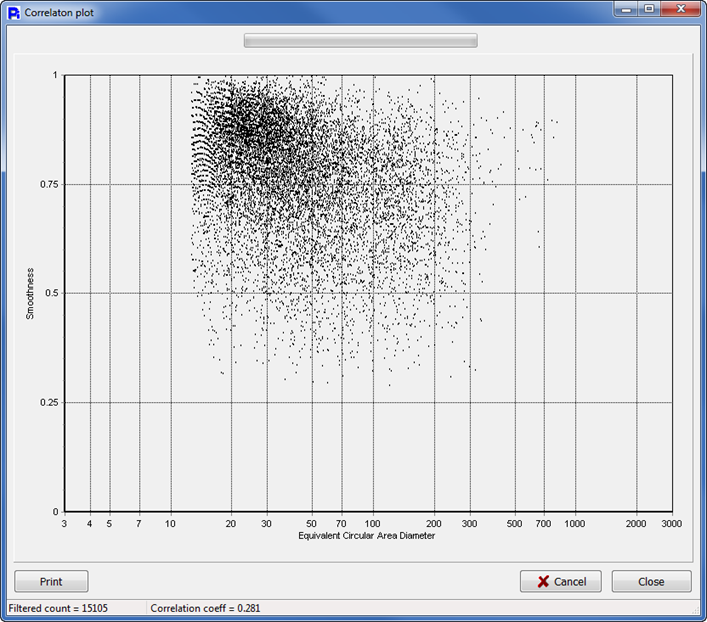
We can also view a correlation of particle smoothness with generalized size. The scatter plot shows that in general smoothness correlates inversely with size – the smoothest objects are the smallest ones.
The Particle Insight post-processing can correlate any two size or shape measures with each other.
Conclusions
To analyze the cement sample in more detail we could separate out three or more particle groups based on size and shape in the post-run processing. For example the almost-round group has high circularity and smoothness with low aspect ratio. That group could be isolated by placing an upper or lower limit, or both, on those three measures in the “Filter Criteria” window. The “stick-like” objects would have low circularity with medium smoothness. The highly irregular shapes would be isolated using the smoothness measure. Further refinements could be made by filtering on most or all of the measures used.