Particle Analysis Services
Vision Analytical Inc. can analyze your samples in our laboratory and generate a report package tailored to your needs. You the user tell us what kind of size and shape characterization is needed, using the information on this page as a guide. Or simply provide a few microscope images of particles and our lab can determine what size and shape measures are appropriate.
THE VA ADVANTAGE
Particle size results from most other analysis methods assume that particles are all spherical in shape. Unless particles are perfectly spherical, size measures related to shape are what the process analyst needs to solve process problems. Vision Analytical’s Dynamic Image Analysis provides exactly that, drawing from six possible shape models.
INDUSTRIES SERVED
Chemical, Paint & Pigment, Pharmaceutical, Abrasives, and many more
PRE-ANALYSIS INVESTIGATION
Vision Analytical will not analyze samples without a full understanding of what the samples are and what the customer needs from the results. Simply sending the customer a particle size report of the analyzed samples is not how Vision Analytical works. Before the analysis, the customer is asked details about their process and what problems they are having. In doing this, Vision Analytical is able to customize the reported results to satisfy the needs of the customer and idenfity the process problem they may have.
Below, there are explanations of how data is computed and the options for reporting it. There are also useful documents in the Tutorials menu. If you are only interested in a subset of your active measures, and a subset of the available statistical values, the reports can be set up to reflect those choices. The amount of data can become somewhat unwieldy, so it makes sense to include only what is actually needed.
![]() See the list of available Size and Shape Measures
See the list of available Size and Shape Measures
 For descriptions of the measures, see Particle Insight Measure Definitions
 ![]()
Sample Statistics
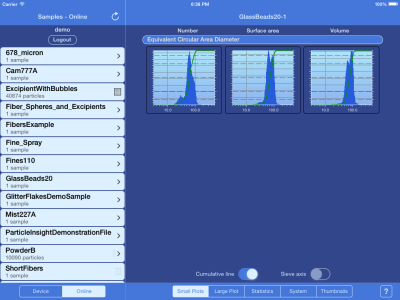
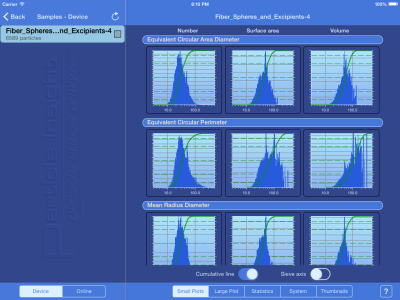
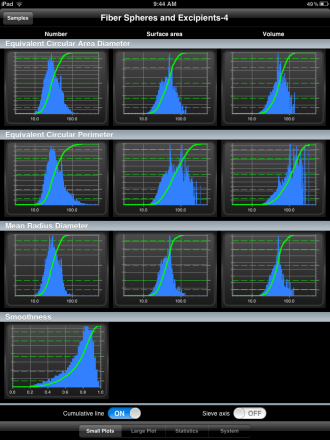
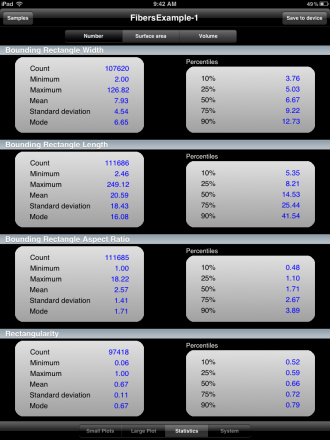
Basic statistical values include:
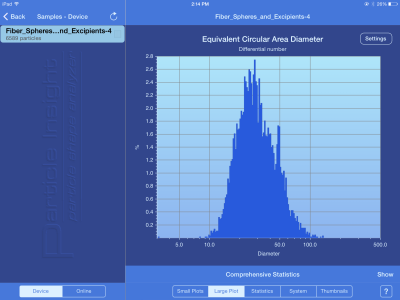
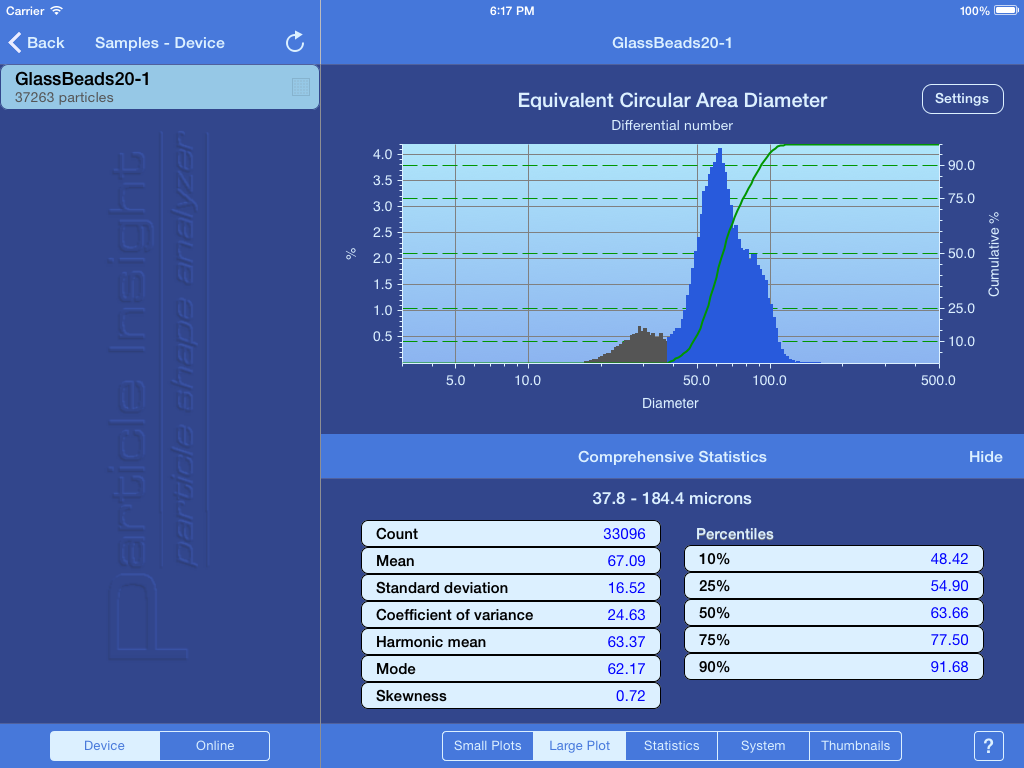
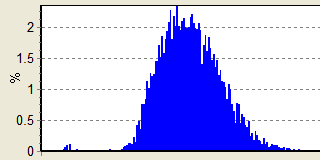
Distribution histograms, weighted by number, surface area or volume
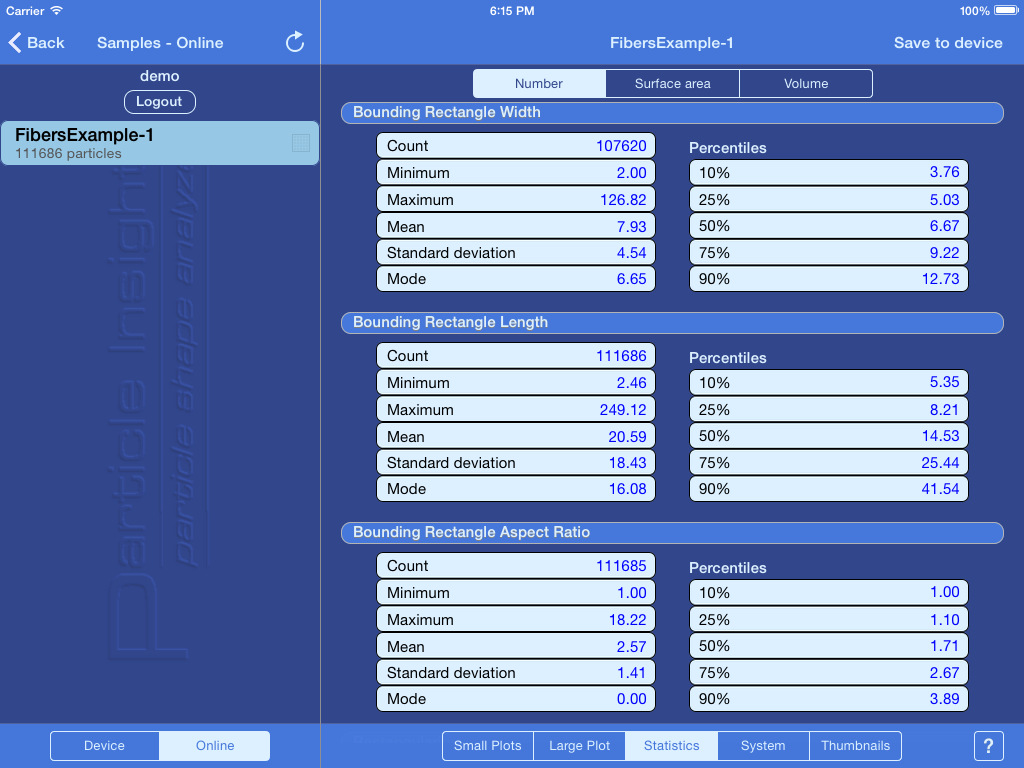
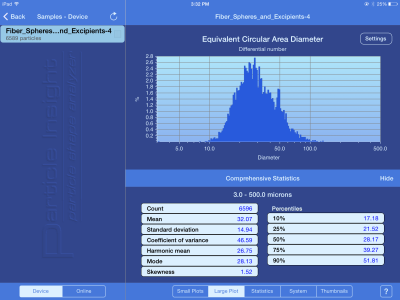
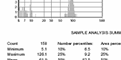
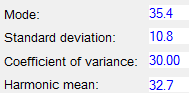
Minimum value, maximum value, mean, standard deviation, mode
Cumulative percentiles: 10%, 25%, 50%, 75%, 90%, by number, surface area or volume
 For definitions and explanations see Statistics Reporting Basics
Data Report Options
Basic Data Reports (choose any of these)
 |
Standard single-run report | Printed, Excel |
 |
Large-format histogram plot | Printed, 1/2 page per plot |
 |
Comprehensive Statistics | Printed |
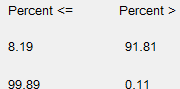 |
Percent less than and greater than | Excel |
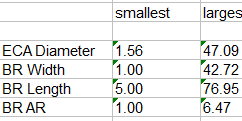 |
Single-run statistics summary | Excel |
 |
Multi-run statistics summary | Excel |
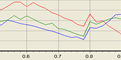 |
Multi-run single-measure distribution overlay plot | Printed, Excel |
Also see: Statistics available in each report type 
Post-run Processing Reports
Notes:
1. The items below require that the option to save individual particle data was in effect during the run.
2. The active x axis range for any measure can be restricted to a subset of the original range by specifying lower and upper limits.
 |
Regenerate all statistics for a new subrange | Printed, 1/2 page per plot |
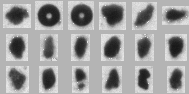 |
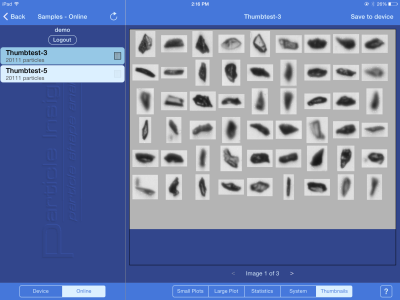
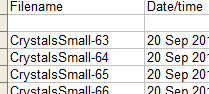
Particle thumbnail images | Printed |
 |
Correlation plots (specify measures) | Printed |
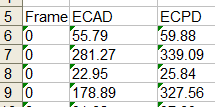 |
Individual particle listing | Excel |
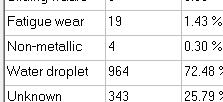 |
Particle classification | Excel |
For all of the above reports, specify which measures and where appropriate, which weightings (number, area, volume) to include. For the statistics summary, specify which statistics to include (see ‘Statistics available in each report type’.)
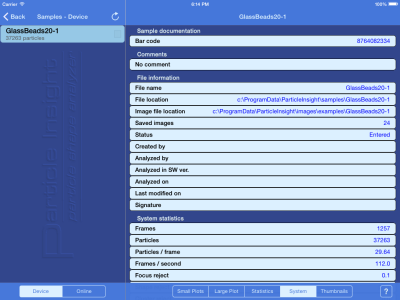
iPad Data Viewer
An option we provide to lab customers is the ability to download their sample reports to their iPad, and review the data anywhere they may be. We will set up a password-protected account on our site server for your data. Data transfers are encrypted in both directions.
For more information on how this app works, click here
For access to the iPad app on the Apple App Store, click here
Apps & Services
Instrument installations sometimes require customization to adapt to the needs of user’s processes. Typical requests include adapting our Particle Insight to an on-line process, or to develop custom sample cells needed for specific applications, or new software features to meet the needs of users and market needs. In some cases, these custom engineering projects become standard features, accessories and instruments for Vision Analytical.
How can we help? To determine if the Vision Analytical Custom Engineering department can develop the solution you are in need of, please contact us. Consultation for your process is at no charge and no obligation, and will be kept confidential. All we need is a description of your current situation, the difficulties involved and what goals you have. We can then begin interacting with you to fully understand your needs and possibly offer a solution.
If your research work requires an analytical device, technique, or configuration that is not commercially available, why not discuss your needs with the experts at Vision Analytical?
Contact us at
Particle Insight Custom Engineering
Phone 305-801-7140
Fax 305-574-7800
Sales@ParticleShape.com
8724 Sunset Drive, #403
Miami, Florida 33173

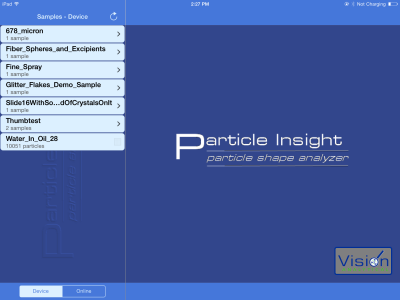
The Particle Insight App for iPad / iPhone
Access your lab data anywhere.

The Particle Insight iPad app is designed to complement the Particle Insight analyzer, which measures particle shape, size, and concentration, and can classify particles into classes based on that data. Scientists and process engineers are now able to view and study data of their raw materials from anywhere in the world as soon as a result is available on their Particle Insight lab instrument.

The first step is to register a machine name and password, using the Support page at ParticleShape.com. You would then enter that information in the Run Conditions options in the PI software. When a run finishes in the Particle Insight instrument, the results can be uploaded automatically to your account on the website, if that option is set, or you can upload manually.

Uploaded data is kept in a secure location at the website, accessible only by the user who set up the account. To download run data from the ParticleShape cloud, start the app in your iPhone or iPad. Go to “Online” and enter your machine name and password. A list of runs available will appear. Click next to a run name to download it.