
Particle Insight Raptor
A Comparison Between Fines and Particle Size
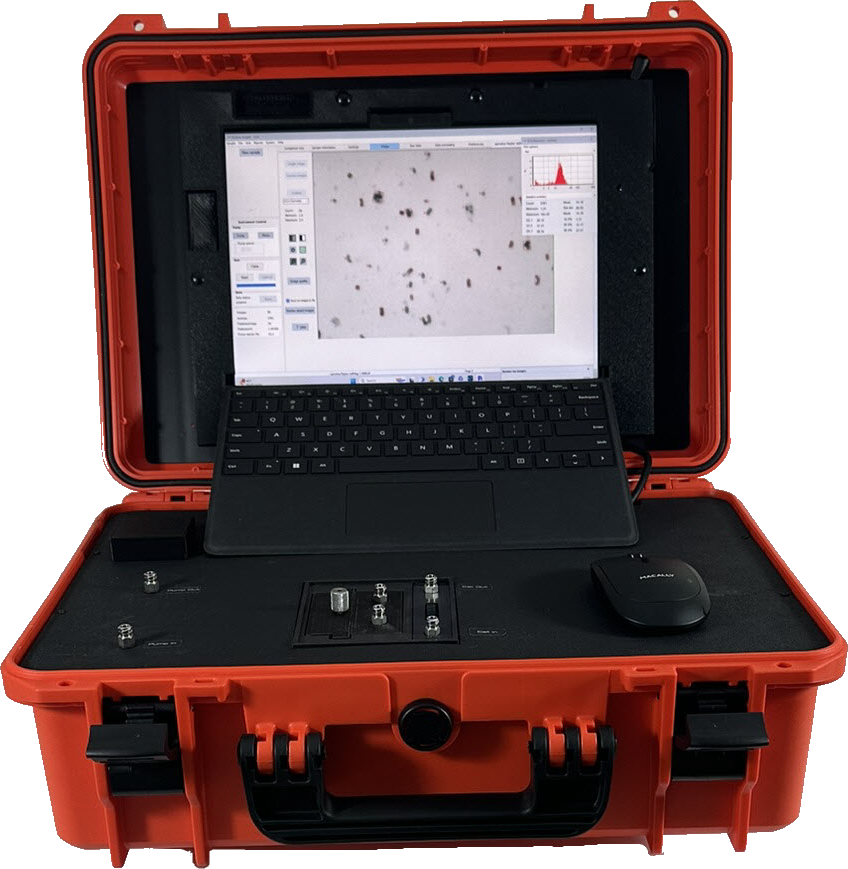
In particle characterization, evaluating both particle size and the presence of fines is critical. This article compares two silicon carbide samples, F8 and F6, to demonstrate how fine particles affect overall particle size distribution (PSD). The analysis is powered by the Particle Insight Raptor — Vision Analytical’s latest and most advanced dynamic image analyzer.
Sample Overview
Silicon Carbide F8
ECA Diameter – Volume: 1.0 – 55.06 µm
- Total count
- 20,057
- Mean
- 11.4 µm
- 10%
- 7.8 µm
- 25%
- 9.0 µm
- 50% (Median)
- 10.6 µm
- 75%
- 12.6 µm
- 90%
- 15.0 µm
Silicon Carbide F6
ECA Diameter – Volume: 1.0 – 55.06 µm
- Total count
- 20,057
- Mean
- 16.4 µm
- 10%
- 10.6 µm
- 25%
- 12.5 µm
- 50% (Median)
- 15.2 µm
- 75%
- 18.8 µm
- 90%
- 22.9 µm
Key Insight: Sample F6 has a mean size approximately 44% larger than F8.
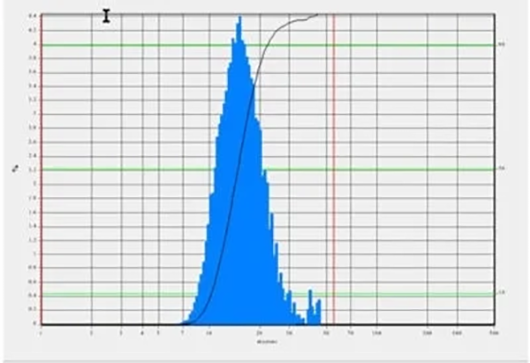
Silicon Carbide F6 — Volume Distribution
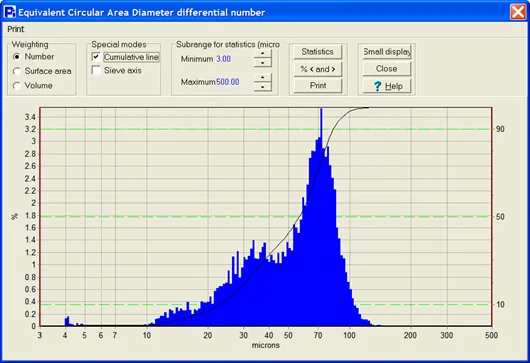
Silicon Carbide F8 — Volume Distribution
Advanced Analysis Using the Particle Insight Raptor
The Particle Insight Raptor provides powerful tools for isolating and analyzing specific size ranges within a sample. This allows users to visually detect and quantify both oversized particles and fines.
Oversized Particle Identification
Particles larger than 30 microns. These few but significantly larger particles in F6 can disproportionately shift the volume-based PSD.
3
Sample F8 >30 µm
36
Sample F6 >30 µm
Visualizing Particle Size Distributions
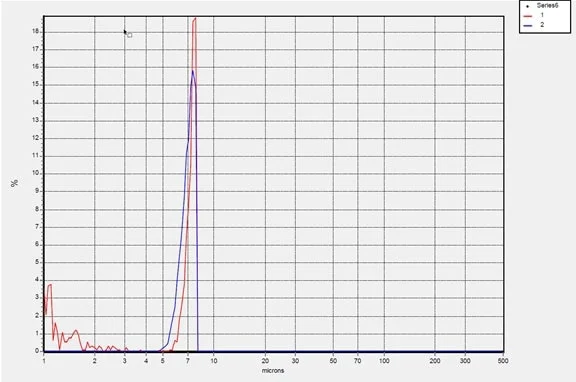
Volume-based overlays emphasize how large particles influence distribution. F6’s larger particles stretch the upper end of the curve. The number-based view reduces the visual dominance of larger particles, showing that large particles are rare in both samples.
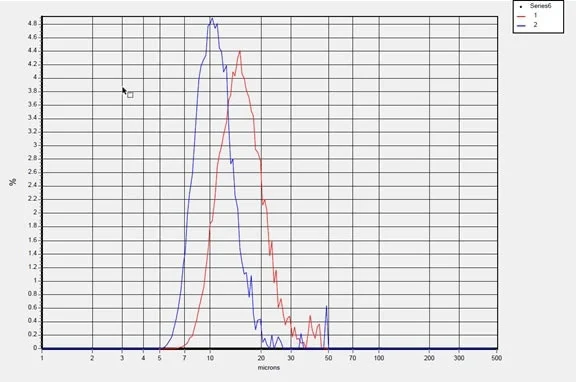
Volume-Based Overlay
Number-Based Overlay
Sample Overview
Silicon Carbide F8
ECA Diameter – Volume: 1.0 – 55.06 µm
- Total count
- 20,057
- Mean
- 11.4 µm
- 10%
- 7.8 µm
- 25%
- 9.0 µm
- 50% (Median)
- 10.6 µm
- 75%
- 12.6 µm
- 90%
- 15.0 µm
Silicon Carbide F6
ECA Diameter – Volume: 1.0 – 55.06 µm
- Total count
- 20,057
- Mean
- 16.4 µm
- 10%
- 10.6 µm
- 25%
- 12.5 µm
- 50% (Median)
- 15.2 µm
- 75%
- 18.8 µm
- 90%
- 22.9 µm
Conclusions and Takeaways
The comparison highlights clear differences between the two samples. F6 contains a much higher fines content, which may negatively influence flow behavior, filtration performance, and overall packing density. Additionally, the presence of oversized particles in F6 can distort volumetric measurements and potentially lead to inaccurate quality evaluations. In contrast, F8 demonstrates a tighter and more uniform particle size distribution, making it a more suitable option for applications that require higher precision and consistent material performance.
Fines Content
F6 has a significantly higher fines load, which can affect flow properties, filtration, and packing density.
Oversized Particles
Larger particles in F6 may skew volumetric metrics and mislead quality assessments.
Distribution Tightness
F8 shows a more uniform and tighter particle size spread — ideal for precision-demanding applications.
Why Use the Particle Insight Raptor?
The Raptor enables detailed investigation into both particle size and shape, along with automated statistical breakdowns of custom size ranges. A critical advantage over legacy particle sizers.
FAQ
Frequently Asked Questions
What is the main purpose of comparing silicon carbide samples F8 and F6?
The comparison aims to evaluate how fine particles and particle size distribution (PSD) influence the overall characteristics of silicon carbide samples and how they affect performance in different applications.
What instrument was used to analyze the particle size distribution?
The analysis was conducted using the Particle Insight Raptor, an advanced dynamic image analyzer developed by Vision Analytical for detailed particle size and shape characterization.
What is the average particle size of silicon carbide sample F8?
Sample F8 has a mean particle size of 11.4 microns, indicating a relatively smaller and more consistent particle distribution.
How does the mean particle size of sample F6 compare to F8?
Sample F6 has a mean particle size of 16.4 microns, which is approximately 44% larger than F8, indicating a broader distribution with larger particles.
Why are oversized particles important in particle size analysis?
Oversized particles can shift volume-based particle size distributions, making the average particle size appear larger and potentially misleading quality evaluations.
How many particles larger than 30 microns were detected in each sample?
The analysis detected 3 particles larger than 30 microns in F8 and 36 particles larger than 30 microns in F6, showing a higher presence of large particles in F6.
What are fines and why are they important in particle analysis?
Fines are very small particles, typically below 5 microns, which can significantly affect material behavior such as flowability, packing density, and filtration performance.
How does the fines content differ between samples F8 and F6?
Sample F6 contains significantly more fines, with 256 particles below 5 microns, compared to only 25 particles in F8.
Which sample has a tighter particle size distribution?
Sample F8 shows a tighter and more uniform particle size distribution, making it more suitable for applications requiring consistent and precise particle sizes.
Why is the Particle Insight Raptor useful for particle analysis?
The Particle Insight Raptor allows users to visually isolate particle size ranges, detect fines and oversized particles, and generate detailed statistical data, providing deeper insights than traditional particle sizing methods.
Ready to See Every Particle?
Contact us for sample evaluations, demonstrations, or technical discussions about Hydro Insight and Mastersizer workflows.