
APPLICATION NOTE: AN-013
Differentiating Pollen Types Using Dynamic Image Analysis
Introduction
Pollen particles vary significantly in morphology across species. While different varieties share similar size ranges, their shapes — including circularity, surface smoothness, and opacity — are often distinctly different. This makes pollen an ideal subject for demonstrating the differentiation power of Dynamic Image Analysis, which measures particles by both size and shape simultaneously rather than size alone.
Six varieties of pollen were analyzed to determine whether shape characteristics could serve as a reliable differentiator between species and between whole pollen grains and debris: Alder, Short Ragweed, Pecan, Redtop, Timothy Grass, and Paper Mulberry.
Why Shape Matters for Pollen Analysis
Particle size instruments that assume all particles are spherical report a single equivalent diameter. For pollen, where particles of different species often fall within the same size range, this approach cannot distinguish one type from another. Shape parameters — particularly circularity, smoothness, and opacity — provide the additional discrimination needed to differentiate species, identify debris, and detect cross-contamination within a sample.
Applicable Measures
| Measure | Range of Acceptance |
|---|---|
| Equivalent Circular Area Diameter | 1 – 500 microns |
| Circularity | 0 to 1.0 |
| Smoothness | 0 to 1.0 |
| Opacity | 0 to 1.0 |
Procedures
All six pollen samples were prepared by suspending them in water and dispersing prior to analysis. Each sample was analyzed using the Raptor BenchTop Dynamic Image Analyzer, which analyzed thousands of particles per sample in minutes and generated up to 32 simultaneous size and shape parameters per particle. Thumbnail images of every measured particle were stored for visual confirmation.
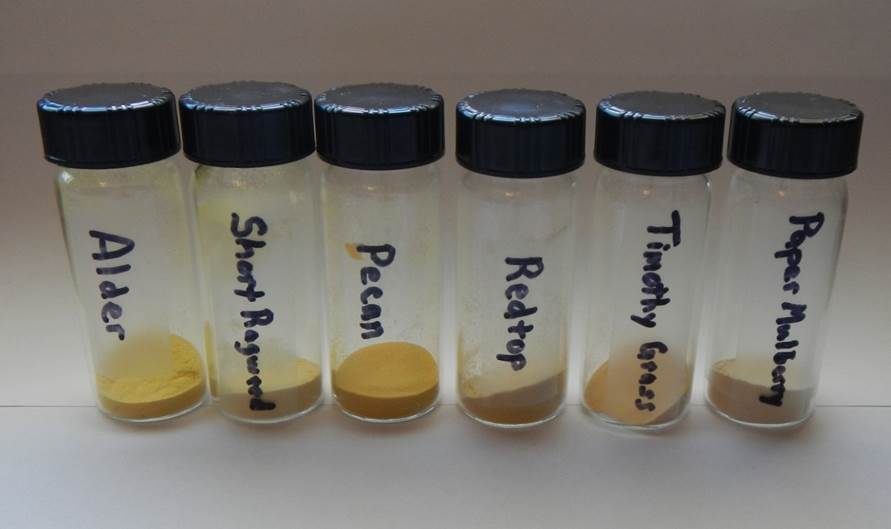
Figure 1: Overview of the six pollen types analyzed in this study.
Results by Pollen Type
Timothy Grass Pollen
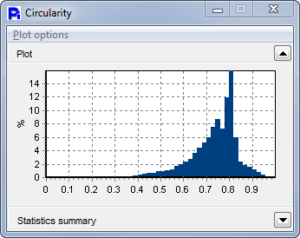
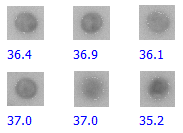
Timothy Grass pollen showed a unimodal size distribution but with a broad range of circularity values, indicating shape variation within the population. Thumbnail images confirmed the presence of both uniform spherical pollen grains and irregular particles that represent debris or fragments of broken pollen grains. A correlation plot of circularity versus size was used to characterize the outlying particles and distinguish them from the main population.
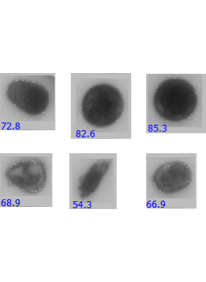
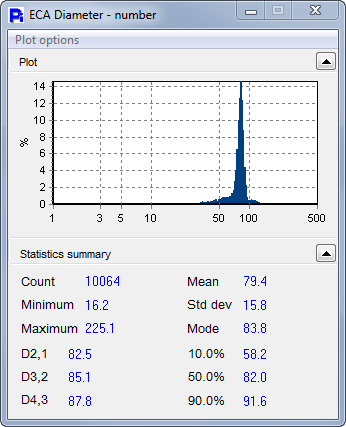
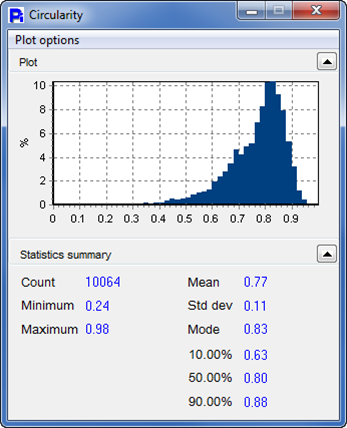
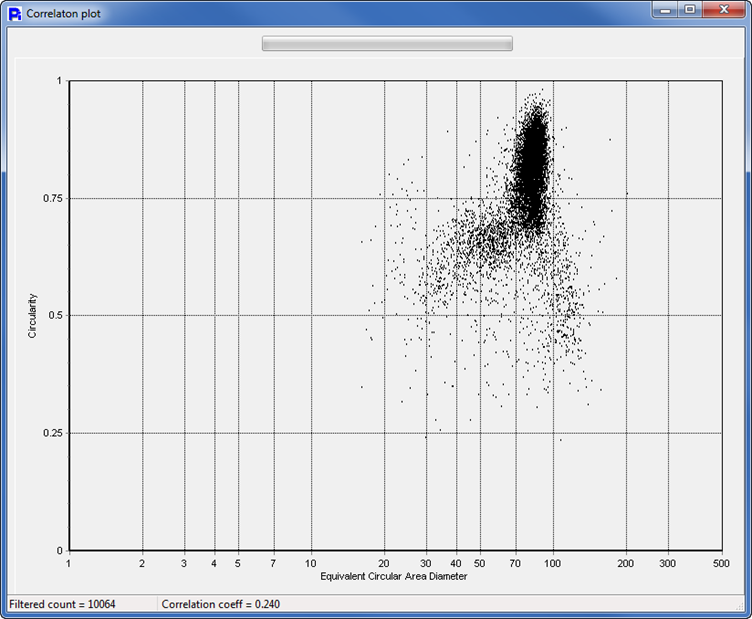 Figures 2–5: Timothy Grass pollen size distribution, thumbnails, circularity histogram, and circularity vs. size correlation plot.
Full Timothy Grass test report (PDF)
Red Top Pollen
Red Top pollen grains appear uniformly dark in imagery but show a bimodal opacity distribution, reflecting significant variation in internal particle density. Thumbnail images reveal a mix of intact pollen grains alongside fragmented particles and debris.
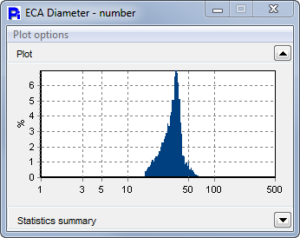
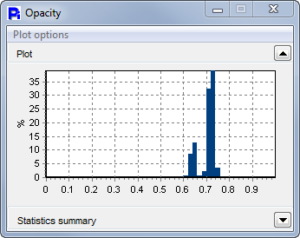
Opacity — calculated as the average intensity of a particle on a scale from 0 (fully transparent) to 1 (completely opaque) — is a highly effective metric for distinguishing particle types within this sample. The Raptor BenchTop allows the population to be sorted and analyzed by any measured parameter, including opacity. The fragmented particles are visible in thumbnail images and also represented statistically as smaller particles in the ECA Diameter distribution. A correlation plot confirms that these lower-opacity particles also exhibit low smoothness, reinforcing their classification as non-uniform debris.
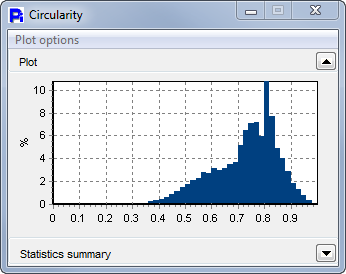
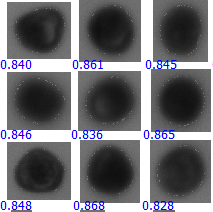
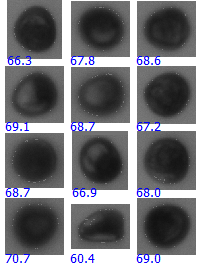
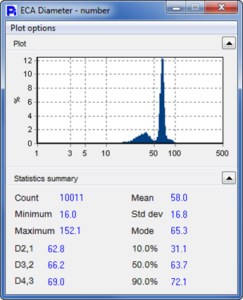
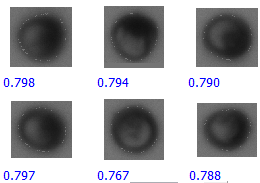
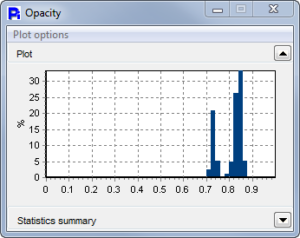
Figures 6–12: Red Top pollen thumbnails, opacity histogram, size distribution, and correlation plots.
Paper Mulberry Pollen
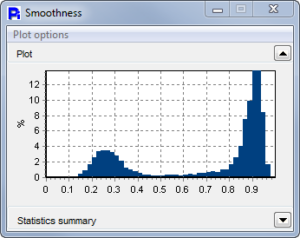
Paper Mulberry pollen has very uniform size and opacity, as shown in the statistical histograms — indicating a consistent particle population in those dimensions. However, the smoothness distribution shows a bimodal pattern, suggesting two distinct morphological subgroups. Thumbnail images support this observation: particles with lower smoothness values correspond to intact pollen grains that differ in overall shape. This highlights the value of shape analysis even within visually consistent samples.
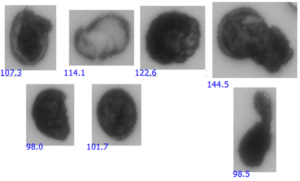
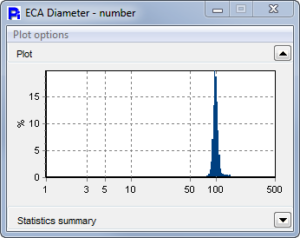
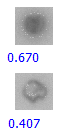
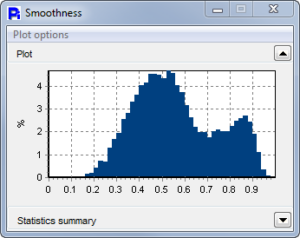
Figures 13–17: Paper Mulberry pollen thumbnails, size, opacity, and smoothness distributions.
Pecan Pollen
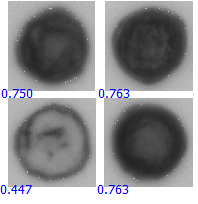
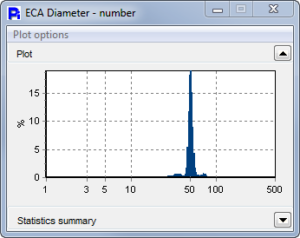
Pecan pollen is an excellent example demonstrating that size data alone is insufficient. The ECA Diameter shows a unimodal distribution, suggesting uniform spherical particles. However, once circularity, smoothness, and opacity are reported, the sample reveals a wide variety of particle shapes. Pecan pollen clearly demonstrates why shape measurement is necessary for a complete characterization.
 [
[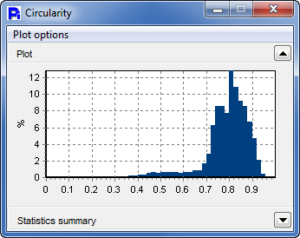
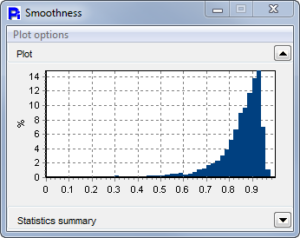
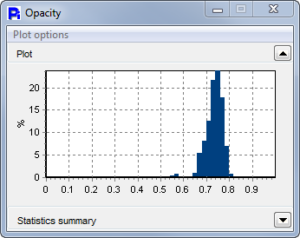
Figures 18–23: Pecan pollen thumbnails and size, circularity, smoothness, and opacity distributions.
Short Ragweed Pollen
Short Ragweed pollen exhibits extremely homogeneous size, circularity, and opacity — making it one of the most uniform samples in this study. The tight distributions across all shape parameters are consistent with a clean, well-preserved pollen population with minimal debris.

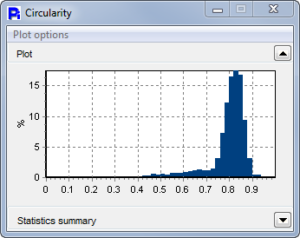
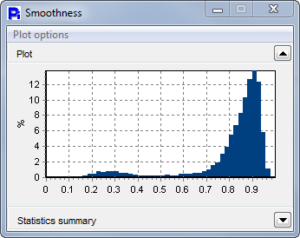
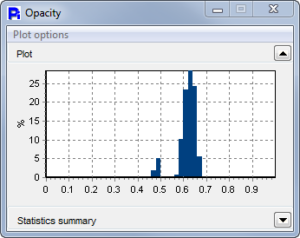
Figures 24–28: Short Ragweed pollen thumbnails and shape parameter distributions.
Alder Pollen
Alder pollen analysis reveals a notable proportion of particles with low smoothness. Thumbnail images confirm this is caused by the presence of debris and contaminants that differ significantly from the morphology of intact pollen grains. Identifying these irregular particles is useful for improving pollen sample collection and filtration processes.

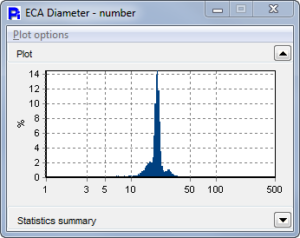
Figures 29–33: Alder pollen thumbnails and smoothness, size, and circularity distributions.
Comparative Analysis and Species Differentiation
Customizable Statistical Reports
The Raptor BenchTop performs high-speed real-time analysis of thousands of particles. Every particle measured is assigned a thumbnail image, a full set of shape measurements, and a frame identification number — all stored for further evaluation. Data can be exported to Excel for individual sample reports or multi-sample comparisons.
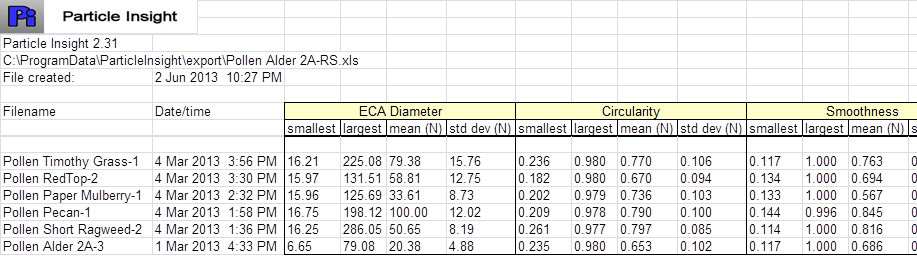
Figure 34: Multi-sample Excel comparison of all six pollen types.
Overlay Analysis
By overlaying all six pollen samples and comparing both size and shape simultaneously, a comprehensive inter-species comparison becomes possible.
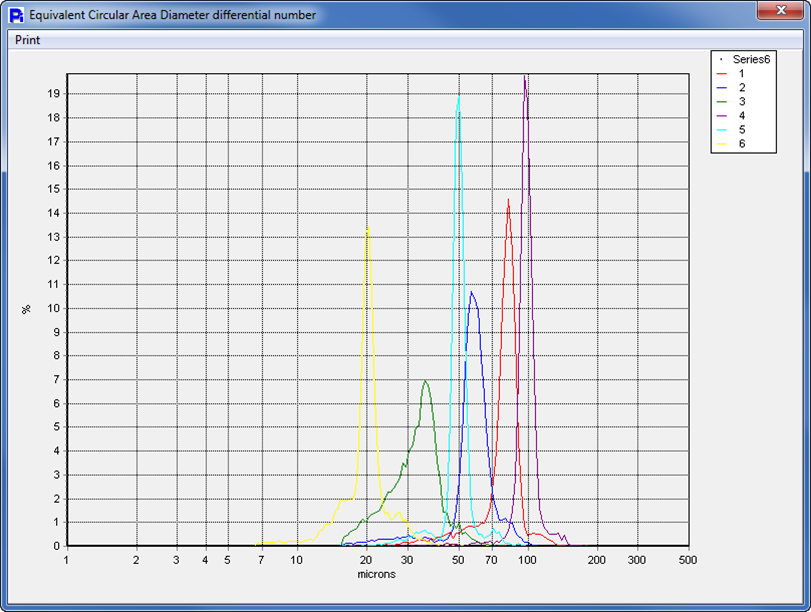
Figure 35: Size overlay of all six pollen samples — all are relatively uniform in size.
As the overlay shows, all samples are relatively uniform in particle size. However, shape parameters differentiate them clearly. This forms the basis for a morphological fingerprint for each species — useful for detecting cross-species contamination within a single sample.
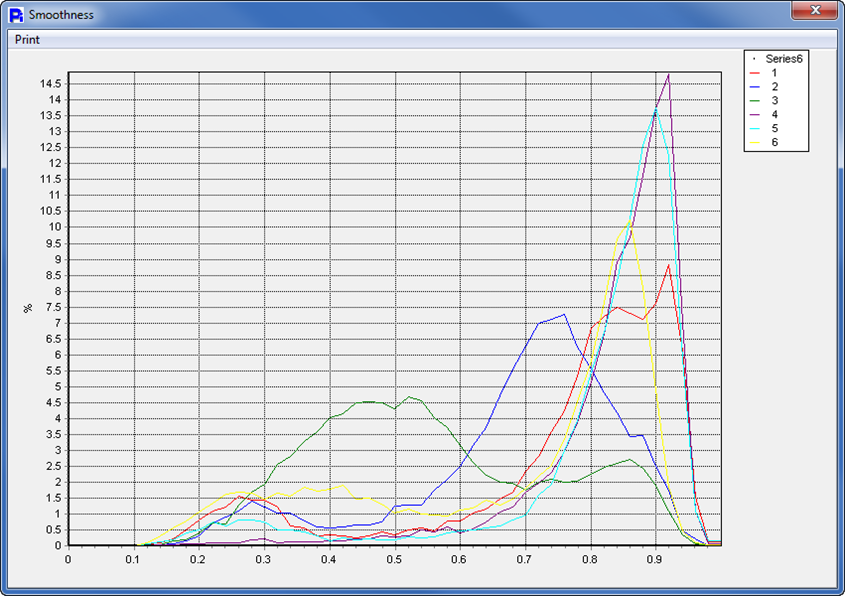
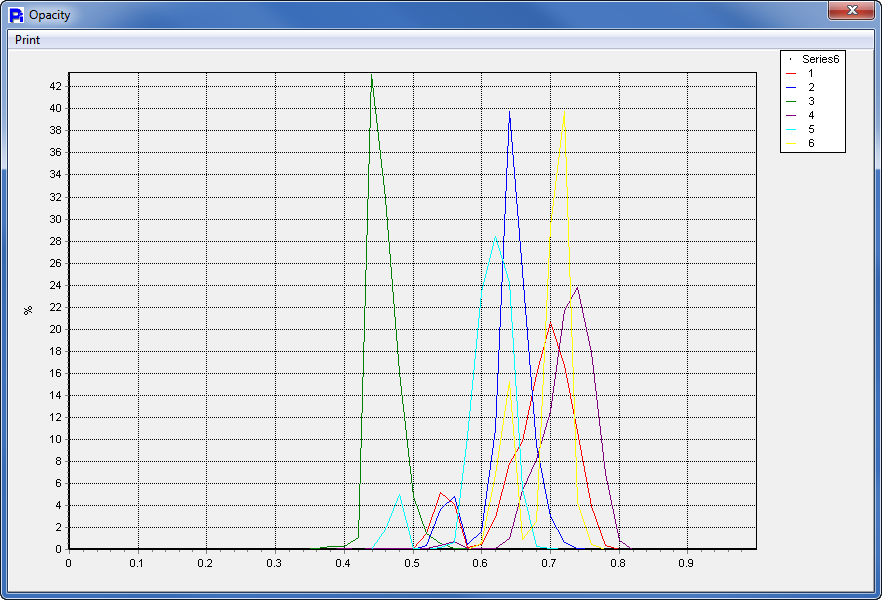
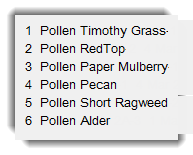
Figures 36–38: Opacity and smoothness overlays across all six species. Paper Mulberry pollen (green line) is dramatically different in both opacity and smoothness.
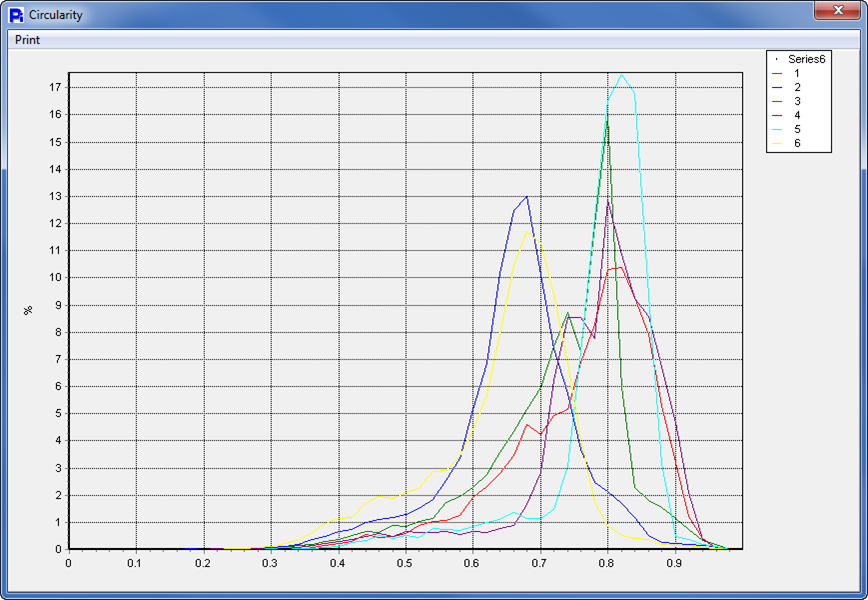
Figure 39: Circularity overlay. Red Top and Alder pollen show the most divergent circularity values, indicating distinct morphological profiles from the other species.
The Raptor BenchTop’s Particle Classification feature can automate the species-differentiation process by grouping particles based on any combination of shape parameters — significantly improving accuracy and efficiency in pollen analysis workflows.
Conclusion
Analysis of six pollen species demonstrates that species differentiation is best achieved by evaluating both particle size and morphology together. Circularity, smoothness, and opacity provide critical insights that size alone cannot. This approach not only distinguishes between species but also identifies dual populations within individual samples — particularly in terms of opacity and circularity, which frequently indicate the presence of both intact pollen grains and debris.
The Raptor BenchTop provides over 32 size and shape analysis measures per particle, along with concentration reporting, particle classification, and flexible data export — making it a comprehensive solution for pollen morphology characterization.
For further reading on pollen morphology, see How Dynamic Image Analysis Works.