
Metal powder producers can hand you a certificate of analysis with a perfect particle size distribution, and the powder can still print badly. That’s because the defects that actually cause clogging, poor flow, and porous parts — fused “satellite” particles, fragments, and shape drift after reuse — often show up in only a small fraction of the lot. A size distribution built from bulk statistics can hide exactly the problem particles you need to catch.
This is a real-world look at how dynamic image analysis helps screen metal powders for 3D printing — identifying outlier particles across virgin, reused, and defective samples. — and why size data alone couldn’t have caught the difference.
What good metal AM powder needs:
- High purity
- Good flowability
- A uniform, controlled particle size distribution
How Important Are Metal Powder Particle Size and Shape?
Virgin metal powder is close to ideally spherical and uniform, which is exactly why it flows and packs so predictably. Once powder has been through a print cycle and gets reclaimed for reuse, that starts to change: particles can fuse together into satellite structures, pick up irregular fragments, or shift in size distribution from thermal cycling. The hard part is that these problem particles typically make up a small percentage of the total lot — you need a technique that reports on individual particles, not just population averages, to catch them at all. For the full comparison of methods used to build this kind of dataset, see our guide on combining laser diffraction and dynamic image analysis for 3D printing metal powder identification.
With So Many Techniques, Why Choose Dynamic Image Analysis?
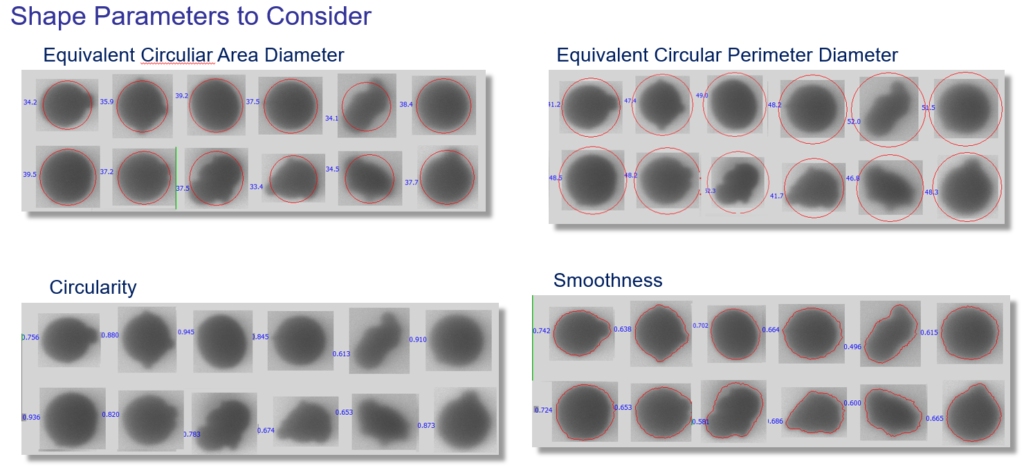
Dynamic image analysis captures an actual image of every particle passing through the measurement zone, which means it reports true shape data — circularity, aspect ratio, elongation — on a per-particle basis, not an assumed-spherical average. That’s what makes it possible to flag and count out-of-spec particles individually rather than just watching a bulk size distribution shift. For more on how this compares with other particle sizing and imaging methods, see how dynamic image analysis works compared to flow imaging microscopy.
Real-World Case Study: Virgin, Spent, and Defective 316L Stainless Steel Powder
Vision Analytical ran three 316L stainless steel powder samples — new, used, and bad (reclaimed, with excessive satellite particles causing print-floor clogging) — through laser diffraction and the Hydro Insight dynamic image analyzer, measuring roughly 10,000 particles per sample.
Laser diffraction alone showed a moderate size shift:
| Sample | Dv10 | Dv50 | Dv90 |
|---|---|---|---|
| New Powder | 17.0 µm | 26.5 µm | 41.3 µm |
| Used Powder | 18.3 µm | 28.3 µm | 43.8 µm |
| Bad Powder | 19.7 µm | 33.5 µm | 57.7 µm |
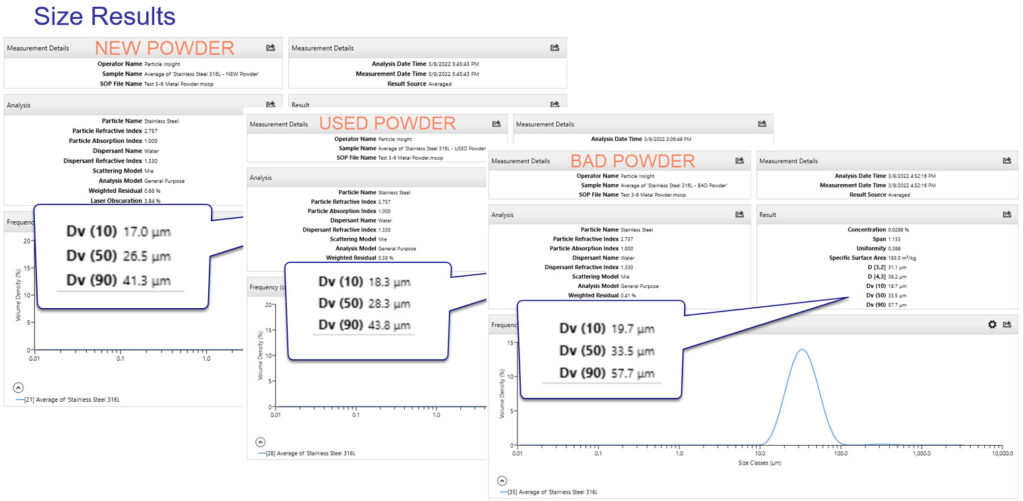
That alone hints at a problem, but it’s the shape data that makes the failure obvious and quantifiable. Dynamic image analysis on the same three samples (~10,000 particles each) showed:
| Sample | Mean ECA Diameter | Mean ECP Diameter | Mean Circularity | Mean Smoothness |
|---|---|---|---|---|
| New Powder | 36.07 µm | 55.10 µm | 0.823 | 0.649 |
| Used Powder | 36.85 µm | 61.20 µm | 0.794 | 0.620 |
| Bad Powder | 43.94 µm | 74.88 µm | 0.786 | 0.600 |
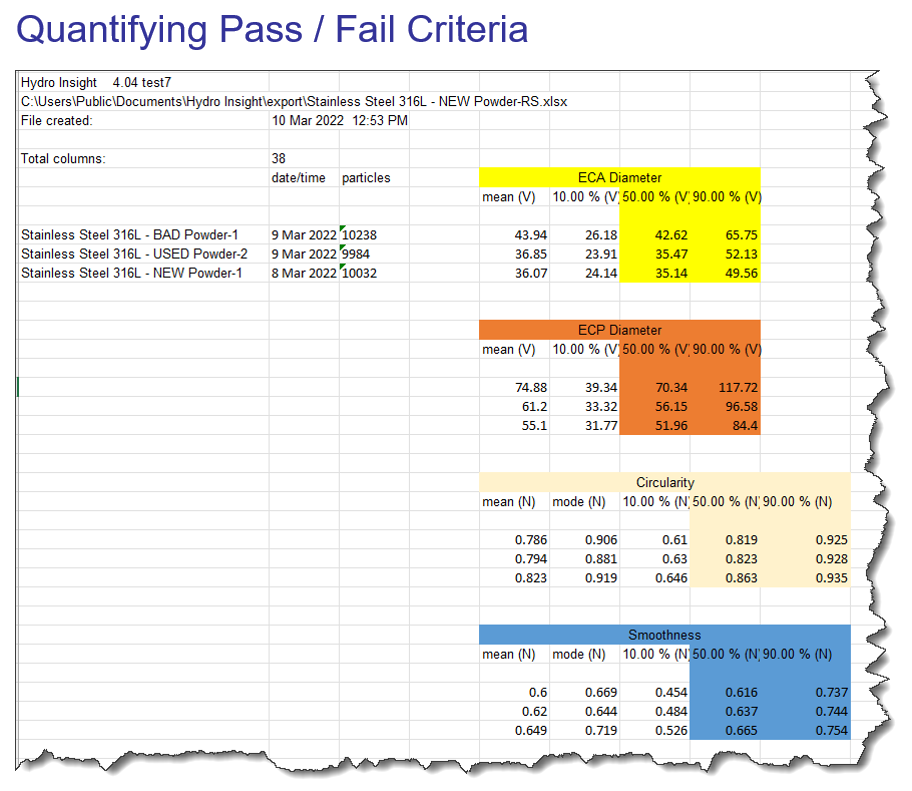
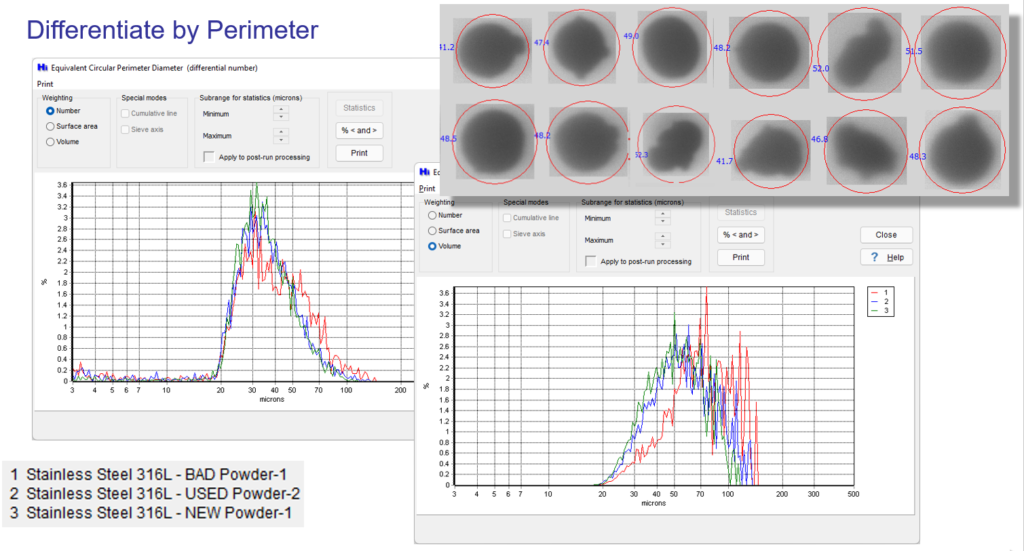
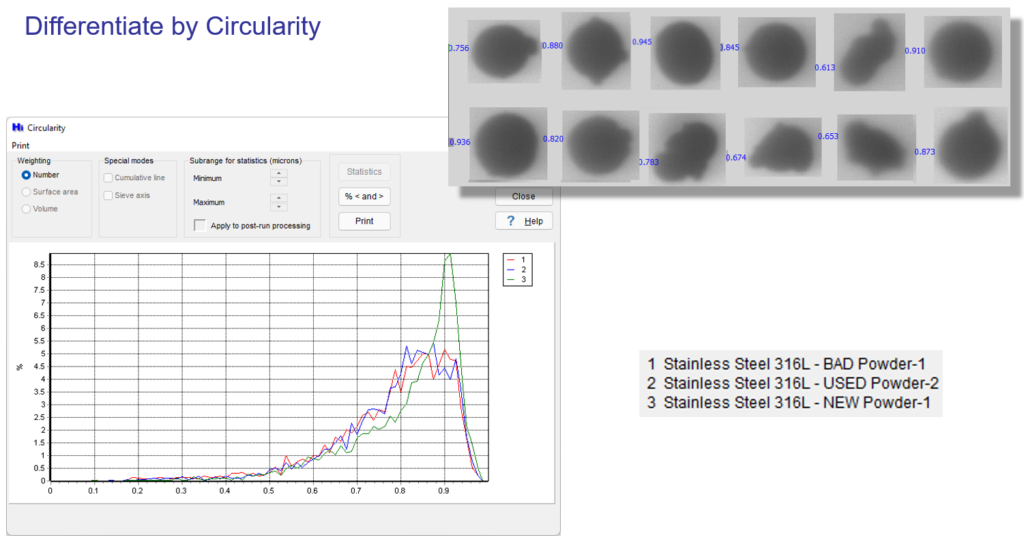
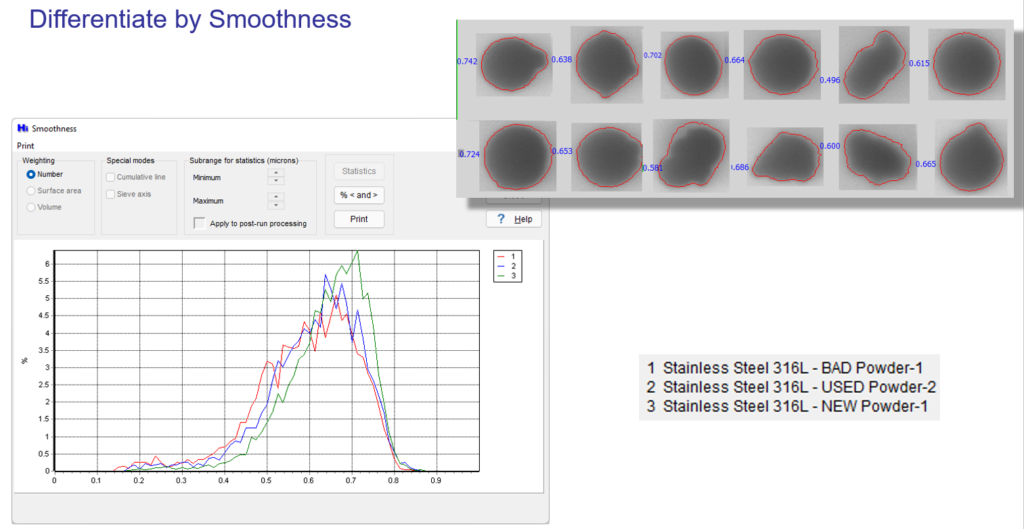
The bad powder’s mean effective diameter (ECA and ECP) jumped noticeably relative to the new and used lots — a direct signature of satellite particles and agglomerates inflating the apparent particle size — while circularity and smoothness both declined step-wise from new to used to bad. That step-wise shape decline is exactly the kind of signal a size-only certificate of analysis cannot surface, and it’s a much clearer go/no-go signal than a subtle shift in a bulk size distribution.
Overlaying the particle-by-particle data makes the separation even clearer:
Watch: differentiating new, used, and bad 316L stainless steel 3D printing powder using laser diffraction and dynamic image analysis.
Related Reading: The Full Laser Diffraction + Imaging Methodology
If you want the broader picture — how laser diffraction and dynamic image analysis work together, and what parameters to track for incoming QC — see our companion guide, Using Dynamic Image Analysis & Laser Diffraction for 3D Printing Metal Powder Identification. For instrument options suited to abrasive, dry metal powders, see our notes on wet vs. dry suspension analysis of tungsten metal powders and our recirculating dry powder suspension module for higher sample throughput.
FAQ
Can particle size distribution alone catch defective metal AM powder? Not reliably. Problem particles — satellites, fragments, agglomerates — often make up only a small percentage of a lot, so their effect on a bulk size distribution can be subtle even when they’re enough to cause clogging or poor part quality. Per-particle imaging catches what population averages hide.
What’s a satellite particle? A satellite particle is a small particle fused to the surface of a larger, otherwise spherical powder particle, typically formed during powder atomization or through repeated thermal cycling in reuse. Satellites disrupt flowability and packing even when the base particle size is within spec.
How many times can metal powder be reused in additive manufacturing? It depends on the material and process, but reuse limits should be set based on measured shape and flow degradation, not a fixed cycle count — which is exactly what dynamic image analysis screening is used to determine.
Are You Ready to Use Dynamic Image Analysis?
If you’re currently relying on size distribution alone to release metal powder lots, this is the gap dynamic image analysis closes: size, shape, particle counts, and images of the specific particles causing problems. Get expert advice from our applications team or browse related application notes to see it applied to your material.
to help you. Call 305-801-7140 or email Sales@ParticleShape.com today!