
APPLICATION NOTE: AN-007
Purpose
Stem cells are undifferentiated cells with the capacity to develop into specialized cell types, making their characterization a critical component of therapeutic research and cell therapy development. This application note describes how Dynamic Image Analysis with the Raptor can be used to measure stem cell size, shape, opacity, and concentration in a single automated analysis — providing researchers with quantitative data to support differentiation studies, viability assessment, and population classification.
Background
As stem cells progress toward differentiation or apoptosis, their physical properties change. Cell morphology — including size, circularity, and opacity — can serve as indicators of cell state. Traditional particle sizing techniques report only size and assume spherical geometry, which limits their utility for biological cell populations that include subpopulations of varying shape and darkness. Manual microscopy provides visual information but is low-throughput and operator-dependent.
Automated Dynamic Image Analysis addresses both limitations. As cells pass through the instrument’s detection zone, images are captured and analyzed in real time, generating size and shape histograms across thousands of particles per minute. This throughput, combined with visual thumbnail confirmation, makes it well suited for stem cell characterization in a research or process development setting.
Instrument Overview
The Raptor 1788 is a dynamic image analyzer that determines particle size and shape simultaneously. For stem cell applications, the instrument captures particle thumbnails for all measured cells and organizes them for post-analysis review. Data can be exported directly to Excel for further statistical analysis, and overlays can be generated to compare populations across samples or time points.
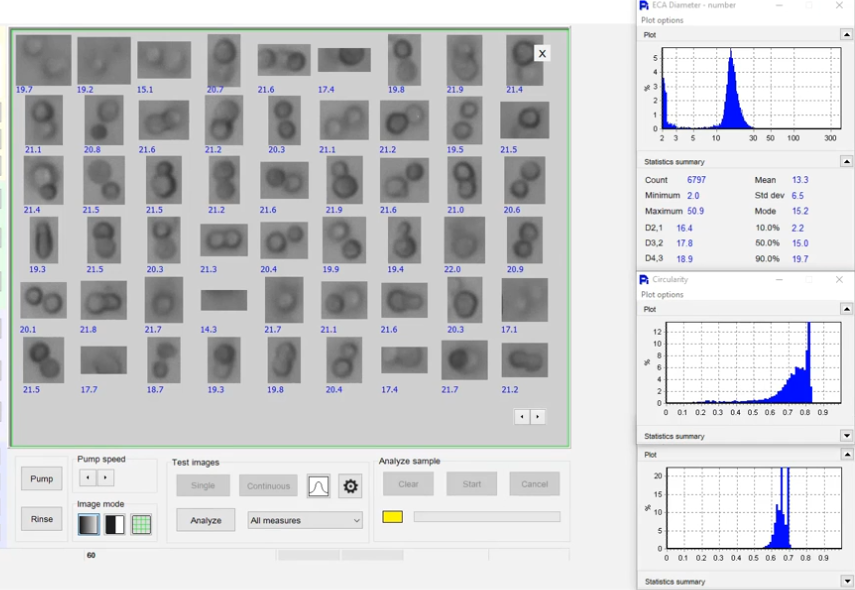
Figure 1: Raptor 1788 screen capture showing stem cell thumbnails and shape parameter histograms.
Key Measurement Parameters
Size — Cell diameter distribution across the measured population, reported as equivalent circular diameter.
Circularity — A measure of how round each cell is. Cells becoming more elongated — as may occur during differentiation or progression toward apoptosis — will show a decrease in circularity over time, making this a useful morphological indicator of cell state.
Opacity — A measure of how dark each cell appears in the image. Opacity differences can reveal subpopulations within a sample, such as live versus dead cells or cells at different stages of differentiation. While the Raptor 1788 is not a dedicated viability analyzer, opacity distributions can provide a first-pass indication of population heterogeneity.
Concentration — The instrument reports particles per milliliter, providing an enumeration of the cell population. Cluster rejection settings can be adjusted to minimize the contribution of cell aggregates to the concentration count.
Advanced Analytical Features
Correlation Plots — Any two measured parameters (e.g., size vs. opacity) can be plotted against each other to test hypotheses about cell population behavior. For example, a researcher can ask whether there is a correlation between cell size and darkness across a population, and identify outliers that may represent a biologically distinct subpopulation.
Rare Event Detection — Because the Raptor 1788 captures thumbnail images of every measured particle, individual cells of interest can be identified within a population of 50,000 or more. A cell with unusually high circularity, extreme size, or anomalous opacity — which would be invisible in a bulk histogram — can be located and examined directly. This capability would be impractical using bulk measurement techniques or manual image review.
Particle Classification — The instrument’s classification feature allows the population to be segmented into user-defined classes based on any combination of size and shape parameters. Example classes for stem cell work might include: small round cells, large round cells, elongated cells, dark cells, light cells, and unclassified. Each class is reported with particle count, percentage of total population, mean size, and standard deviation — enabling a full statistical breakdown of each morphological subpopulation independently of the others.
Supporting Video
A demonstration of the Raptor 1788 applied to stem cell analysis is available at: https://www.youtube.com/watch?v=9zMiVaRaj1o
Conclusion
Dynamic Image Analysis with the Raptor 1788 provides a comprehensive characterization of stem cell populations in a single automated measurement. Thumbnail review delivers qualitative confirmation of cell morphology, while correlation plots, particle classification, rare event detection, and Excel export provide the quantitative layer needed for research documentation and process development. The combination of size, shape, opacity, and concentration data in one analysis makes the Raptor 1788 a practical tool for researchers working with stem cells and other biological cell populations.
For related pharmaceutical particle characterization applications, see our USP <788> and <1788> compliance guide.