
APPLICATION NOTE: AN-003
Particle Measurement Technologies. How are they different?
Irregularly shaped particles require analysis with random orientation to ensure accurate results.
Introduction
In various industries, it is important to measure the size of liquid particles in a suspension. These could be as simple as oil droplets suspended in water or water droplets suspended in oil. There are other instances in pharmaceutical applications where liquid dosages may be encapsulated inside a harder outer shell. In many of these cases, the end user may have a need to determine the size of these globules, the shape, and possibly the concentration. However, the challenge is using an automated technique that can differentiate between a water droplet and an oil droplet, as well as to differentiate these particles of interest from other debris so as not to impact the concentration measurements. The most common particle measurement techniques can only differentiate particles based on size. In addition, most of these common techniques assume all particles are spherical in shape, which for this globule application is an accurate assumption unless there are non-spherical particles, such as debris, that could incorrectly be measured as part of the main population of particles. In addition, some of the more common techniques require supplementary information about the particles as well as the fluid they are suspended in.
Parameters such as refractive index may be needed to properly measure particles. Given that globules are of one, or various, refractive indexes and the liquid they are suspended in is of a different refractive index, performing measurements of globules presents a challenge using some of the more common particle size measurement techniques. The differentiation between droplet types and debris is also difficult to do with size-only measurement techniques. Because of this, it is difficult to use the more common techniques to properly measure concentration and to even detect globules suspended in liquid. End users are then limited to using manual microscopy to ensure the particles in question are being identified and measured properly. Microscopy allows the end user to view the particles in question and to differentiate one type of globule from another visually. In addition, it allows the user to identify debris or other particles that are not globules, to ignore them or act on the fact that they are present in the sample. The problem is that these manual methods tend to be tedious and time consuming.
In addition, manual microscopy is not a practical technique for measuring an adequate population of sample to ensure statistical assurance. Microscopy also has a tendency of deforming the sample as it is put on a microscope slide — something not experienced in Dynamic Image Analysis, where globules can flow freely.
Combining the speed and accuracy of the more common methods with the visual abilities of microscopy has been accomplished with Dynamic Image Analysis. This method enables users to differentiate not only on size, but also on numerous other shape parameters in a high-speed automated measurement. Dynamic Image Analysis works on the principle that as particles pass through a detection zone, images are captured and analyzed. ISO 13322-2 is used as the guideline for all Dynamic Image Analysis instruments available on the market today. The key benefit of using Image Analysis for globule measurement is the identification, quantification and differentiation of different particles by using Size, Shape, and Opacity measurements. The end user is able, in a single analysis, to perform a size/shape measurement, obtain a concentration measurement of each particle type present, and have thumbnail images of each measured particle. Globules made of different liquids — silicone, water, oil, etc. — all tend to be spherical in nature and can have random sizes, but all would have different opacity (darkness) that can be detected and used as a differentiation discriminator of each type of globule. In addition, the presence of debris (non-globules) is also captured and reported. One additional benefit that Dynamic Image Analysis brings is the ability to show particle thumbnails of each measured particle for visual confirmation and identification.
Experimental #1:
For this experiment the Particle Insight Raptor Particle Shape and Size Analyzer was used to measure an oil sample from an airplane engine. In this case the engine had significant wear and thus resulted in cooling liquid (water based) present in the oil. Below is a single screen capture of the sample analyzed on the Raptor.
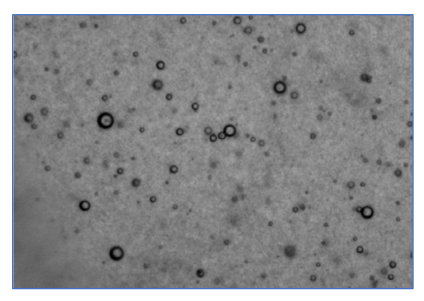
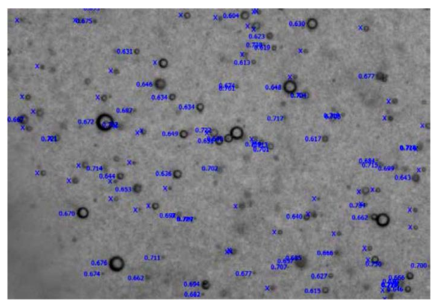
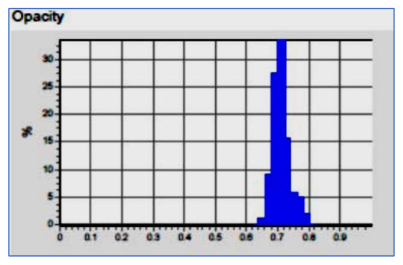
On a real-time basis, the Raptor can analyze the particles on the screen and perform 30 shape measurements, as well as save the individual particle thumbnail images. As can be seen here, the Raptor can eliminate or ignore particles that are out of focus. In this case the measurements shown are for the Opacity of each particle. It is also interesting to point out that water droplets in oil come in different sizes; however, debris that was also found in this sample was distinguishable by its irregular shapes (lower Circularity values, lower Smoothness values, and darker Opacity values).
Thousands of particles were measured in a matter of a few minutes. However, because the Raptor has no lower limit on concentration detection, even if very few particles were present, the recirculation of the sample would capture any rare-event particles.
Typical Opacity histogram showing distribution of particles based on how dark they are. Air bubbles and debris tend to have a higher Opacity value than liquid globules.
.
Experimental #2:
This next experiment was the detection of oil droplets in water. As can be seen here, there are large oil globules as well as some air bubbles. The easy way for the Raptor to differentiate between an oil droplet and an air bubble was using the opacity measurement.
Smaller debris is present, as can be seen in the background. The smaller debris can also be measured in real-time, or the instrument settings can be adjusted to ignore it.
.
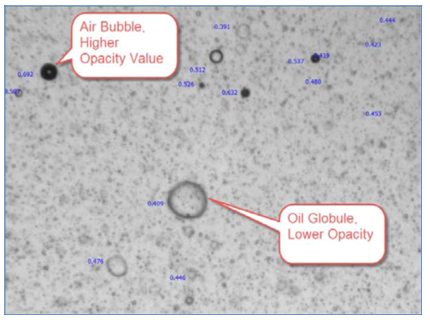
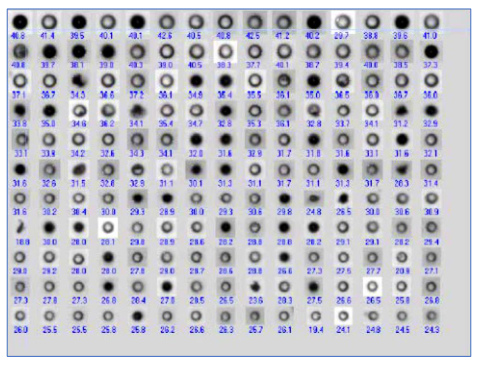
After analyzing tens of thousands of particles in minutes, the Raptor shows all thumbnail images.
As can be seen here, lighter round particles are globules, while darker round particles are air bubbles and darker irregular particles are debris. Relative concentration of all three populations can be given and is important to know.
Experimental #3:
The images below were from a pharmaceutical time-released sample that has an inner globule encapsulated in a hard outer shell. In this sample the customer was interested in determining the thickness of the coating.
All particle size instruments can measure the inner particle when not coated and report the same size, because these are spheres.
After the particles have been coated is where most other particle size instruments have a problem. Because the coating is clear, optical instruments like light obscuration and laser diffraction are not able to exclude the inner particle from the analysis, and the clear coating combined with the suspending liquid can cause the outer shell to disappear. For opaque coatings, all particle size instruments are able to measure the coating.
The Raptor 1788 has advantages over the few other instruments that can also measure the clear outer shell, and has advantages over sizing opaque coatings.
For clear coatings, the Raptor 1788 can measure both the inner and outer particles in one analysis, because Dynamic Image Analysis offers the ability to change the dark threshold of image detection. The Raptor 1788 could perform an automated analysis of the sample, analyzing the inner globule particle. Once this analysis was completed, the same sample was then analyzed with a different threshold condition where only the outer ring (the shell) was analyzed for size and shape.
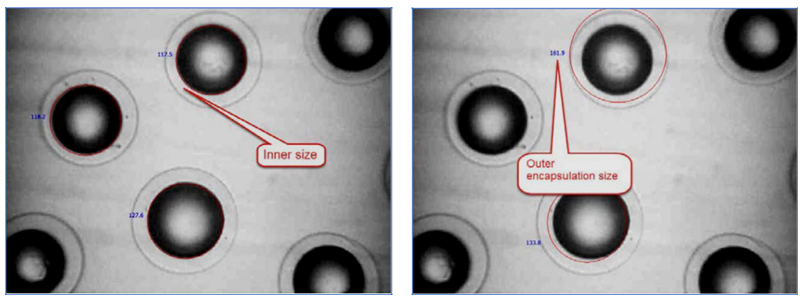
Another advantage the Raptor offers for coatings, clear or opaque, is the ability to assess how uniform the coating is. The coating can be tested for Circularity, Smoothness, and uniformity. Finally, for clear coatings, the images saved during the analysis can be viewed to see how centered the spheres are within the coatings. Also, if the coated particles are placed in a solution that dissolves the coating, the images and shape measurements will show how evenly the coating dissolves.
Results and discussions:
In all the above experiments the suspension liquid was of different opacities.
- In the case of the encapsulated globules, the suspension liquid was clear.
- In the case of the oil samples, the suspension liquid was dark, used oil. Regardless of this, the Raptor could detect the suspended globule particles. In addition, having the particle thumbnails available enabled us to ensure that the proper parameters were set to capture the particles in question.
- In the oil-in-water and the water/air-bubble-in-oil analysis, there was a clear differentiation in Opacity that enabled us to determine the percentage of water particles, air bubbles, and debris present in the sample.
In this case the end user could determine the health of the equipment the fluid came from, and this was then used as a quality control tool to check the stability of the engine from time to time.
In the case of the encapsulated globule, the end user could perform the analysis on a single aliquot of sample. This was a very efficient way to perform the test and did not require the end user to break the outer shell to perform a size determination of the inner globule.
Conclusions:
Liquid or globule particles suspended in other liquids present difficulties for proper detection using typical size measurement techniques.
The Raptor using Dynamic Image Analysis, has shown to be a valuable tool in the analysis and differentiation of these particle suspensions. In addition, the ability to capture particle thumbnails enables a visual validation of the analysis.
This same opacity-based discrimination is central to subvisible particle characterization in injectable products, where silicone oil droplets, protein aggregates, and air bubbles must be told apart. To see how it is applied under USP <788> and <1788>, see our USP 788 & 1788 compliance guide.