
APPLICATION NOTE: AN-001
Introduction
Automated image analysis has been developed to provide users with a more accurate measurement of their particles. For many years, particle size analyzers have rendered results with the assumption that all measured particles are spherical. However, in many applications, the circularity and morphology of particles directly affects both performance and processability in manufacturing. Those in industry who have recognized that particle irregularity impacts manufacturability and efficacy have often resorted to manual microscopy for shape analysis. Manual microscopy is inherently slow, tedious, and impractical for analyzing statistically meaningful populations. This makes microscopy acceptable for obtaining a general impression of particle shape, but unsuitable for process control.
One raw material ideally suited to shape analysis is fibers. Fiber particles are used across a vast range of applications — from reinforcing building materials and composite structures to producing effective filtration media, nonwoven fabrics, and pharmaceutical excipients. In all cases where raw fibers are used, there is a need to know fiber length, width, aspect ratio, and curl. Results expressed as equivalent spherical diameter do not come close to providing users with critical information about their fibers and how they will perform. Measuring such particles with manual microscopy is equally impractical in a quality control environment where fast, representative analysis is required.
Background — Why Fiber Shape Matters
Fiber geometry directly influences end-product performance in ways that size alone cannot predict. In filtration applications, fiber length and curl determine pore structure and filtration efficiency. In fiber-reinforced composites and building materials, aspect ratio governs tensile strength and load distribution. In pharmaceutical excipients and thickening agents, fiber curl influences viscosity and flow behavior. In all of these cases, a particle size result that assumes spherical geometry provides misleading data.
Dynamic Image Analysis per ISO 13322-2 solves this by capturing images of individual particles as they pass through a detection zone, calculating true fiber-specific parameters directly from each particle’s silhouette — without any assumption of spherical shape. The result is a statistically robust fiber characterization completed in minutes rather than hours.
Experimental
Figure 1 shows a typical fiber from the sample analyzed using the Raptor Portable Dynamic Image Analyzer from Vision Analytical Inc.
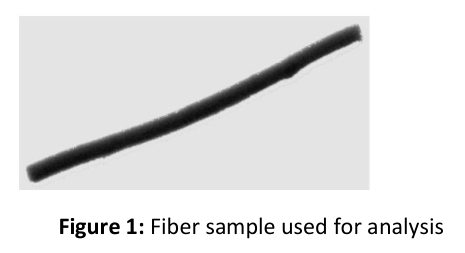
Figure 1: Representative fiber particle from the sample used for analysis.
Analysis of this fiber sample with a conventional particle size analyzer — which assumes all particles are spheres — reports minimal information; in this instance, a size of 112.1 μm. Analysis of the same fiber sample using the Raptor Portable, a proper shape analyzer with dedicated fiber-shape measures, yields substantially more information on a high population of particles in just minutes. The measurement of fiber length and width is calculated along with the aspect ratio (length divided by width). Fiber curl is also reported as a fractional value equal to 1.0 for a perfectly straight fiber — the smaller the value, the greater the degree of curvature. This is particularly useful for predicting how fibers will interact with each other during processing.
Applicable Measures
The four fiber-specific measurements generated by the Raptor Portable for this sample are:
| Parameter | Result |
|---|---|
| Fiber Length | 449.9 μm |
| Fiber Width | 22.7 μm |
| Fiber Aspect Ratio | 19.82 |
| Fiber Curl | 0.984 |
A total of 10,000 particles was analyzed in 149 seconds. Figures 2 through 5 show the statistical distributions for each parameter.
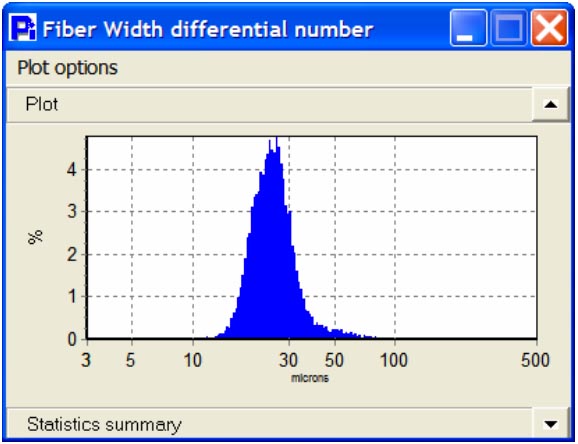
Figure 2: Fiber width distribution. The width of these fibers is uniform in nature, indicating consistent raw material diameter across the population.
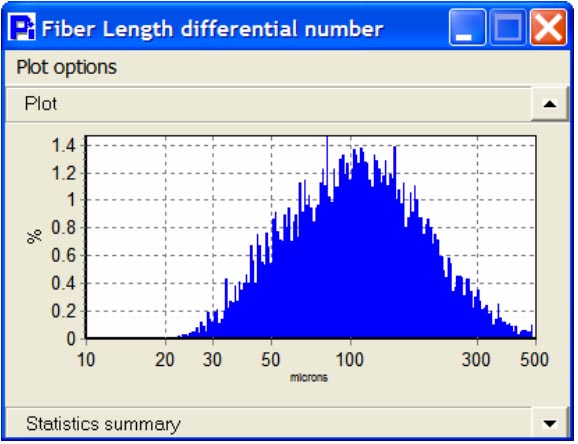
Figure 3: Fiber length distribution. Mean fiber length is 123 μm with a standard deviation of 74.8 μm, indicating broader variability in length than in width.
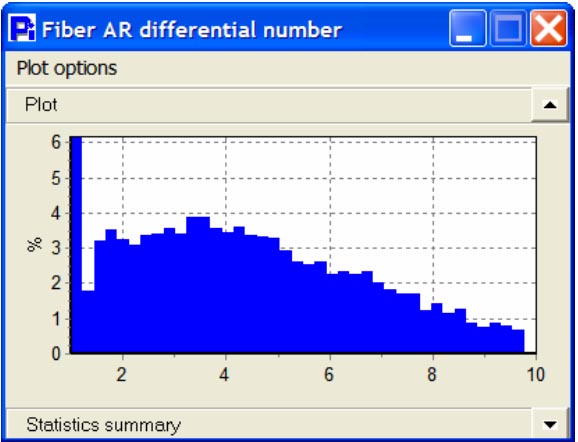
Figure 4: Fiber aspect ratio distribution. Because width is well controlled but length varies, aspect ratio results are broad — mean 4.450 with a standard deviation of 2.262.
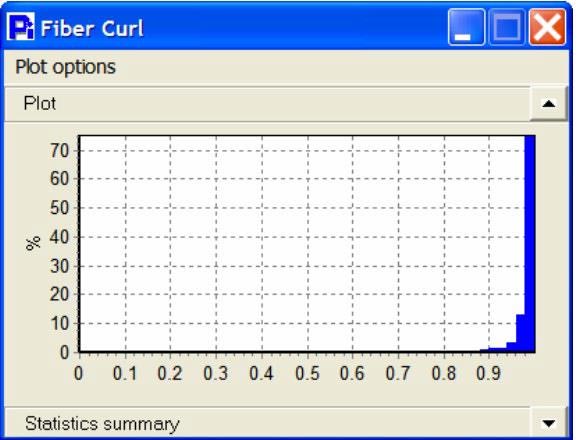
Figure 5: Fiber curl distribution. Mean curl is 0.97 with a mode of 0.99, clearly indicating that the population is predominantly straight with minimal curvature.
Why These Measurements Matter for Quality Control
The data above illustrates something conventional particle sizing cannot reveal: this fiber population has tightly controlled width but broadly distributed length. A size-only result would report a single equivalent diameter and miss this distinction entirely. Knowing that width is uniform while length varies gives a manufacturer actionable information — the raw material is consistently drawn to diameter but cut or processed inconsistently for length. That is a process control finding, not just a characterization result.
The four fiber-specific measures from the Raptor Portable can each be used independently as an incoming quality control specification:
- Fiber Width — controls consistency of diameter across lots
- Fiber Length — flags excessive fines or overlong particles
- Fiber Aspect Ratio — quantifies elongation relevant to strength and filtration performance
- Fiber Curl — detects processing-induced curvature that affects viscosity and packing
Because the analysis is fast, automated, and measures thousands of particles in seconds, it is practical for routine QC environments where manual microscopy is not.
Conclusion
Measuring fibers with the assumption that they are spherical is not just inaccurate — it is uninformative. As demonstrated in this application, the four fiber-specific measures available from Dynamic Image Analysis provide a complete picture of fiber morphology that size alone cannot deliver. Width, length, aspect ratio, and curl each reveal different aspects of how a fiber population will behave in its final application. Used together, they form a practical, fast, and statistically robust basis for incoming quality control and process monitoring.
For related fiber characterization work including cellulose fibers, see AN-017 Particle Shape Analysis of Cellulose Fibers. To learn more about the Dynamic Image Analysis technique, visit How Dynamic Image Analysis Works.