
APPLICATION NOTE: AN-009
Glass Fiber Shape Analysis — Length, Width, and Aspect Ratio
Introduction
Glass fibers are used extensively in composite materials, reinforced plastics, insulation, and filtration applications. Their performance in these end uses is governed primarily by fiber geometry — length, width, and aspect ratio — rather than by equivalent spherical diameter. Conventional particle sizing techniques that assume spherical geometry are therefore poorly suited for glass fiber characterization and can produce misleading results.
Dynamic Image Analysis per ISO 13322-2 addresses this directly by capturing images of individual fibers as they pass through a detection zone and calculating shape parameters from the actual particle silhouette. This note describes the application of DIA to a population of long glass fibers, demonstrating key analytical features including shape parameter selection, correlation plots, rare event detection, particle classification, and multi-sample comparison.
Background — Why Aspect Ratio Matters for Glass Fibers
For elongated particles such as glass fibers, Equivalent Circular Area (ECA) diameter — the standard output of most particle size analyzers — is not a meaningful measure. A fiber 50 microns long and 5 microns wide would report the same ECA diameter as a compact irregular particle of similar projected area, yet the two particles behave entirely differently in a composite matrix or filtration medium.
The relevant measurements for glass fibers are rectangular rather than circular: Feret Width, Feret Length, and the Feret Aspect Ratio derived from them. These caliper-type dimensions directly describe the fiber geometry and are the basis for meaningful lot-to-lot comparisons and incoming quality control.
Experimental
A sample of long glass fibers was analyzed using the Raptor BenchTop Dynamic Image Analyzer from Vision Analytical Inc. The analysis captured 34,000 individual particle images and generated 32 simultaneous shape parameter histograms and 30 shape measures per particle.
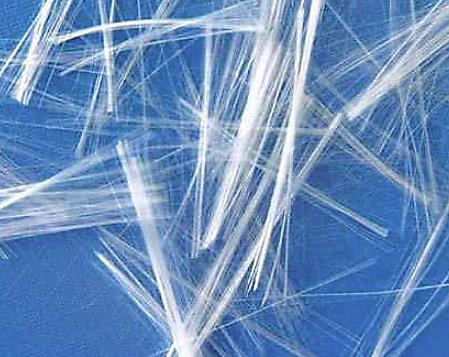
Figure 1: Representative glass fiber particles from the analyzed sample, captured by the Raptor BenchTop.
Shape Parameter Selection
For glass fiber samples, circular shape parameters such as circularity are less informative because the particles are inherently elongated. The most relevant parameters for this application are:
- Feret Width — the minimum caliper dimension, representing fiber diameter
- Feret Length — the maximum caliper dimension, representing fiber length
- Feret Aspect Ratio — Feret Length divided by Feret Width, quantifying elongation
- Bounding Rectangle Aspect Ratio — an alternative elongation measure based on the fitted bounding rectangle
For this sample, fiber lengths extended to approximately 50 microns and widths to approximately 30 microns, with the correlation between length and width showing a predominantly linear relationship across the population.
Advanced Analytical Features
Thumbnail Review
The Raptor BenchTop stores a thumbnail image of every measured particle. For a 34,000-particle run, scrolling through thumbnails provides a rapid qualitative assessment of the population — identifying agglomerates, contaminants, or unexpected morphologies that would be invisible in histogram data alone.
Correlation Plots and Rare Event Detection
Any two shape parameters can be plotted against each other in a correlation plot. For this glass fiber sample, plotting Feret Aspect Ratio against Feret Length showed a predominantly linear relationship — as particles grew longer, they also grew wider. No rare events outside the linear trend were detected in this sample. This feature is particularly valuable for identifying anomalous particles that fall outside expected morphological boundaries — outliers that histograms would obscure within the bulk distribution.
Particle Classification
The particle classification feature segments the population into user-defined subgroups based on any combination of shape parameters. For glass fiber analysis, two subpopulations were defined: long, wide fibers and long, thin fibers. Each subgroup was analyzed independently, yielding separate size and shape statistics for each morphological class. This is useful for characterizing mixed-fiber populations or detecting lot-to-lot shifts in fiber geometry.
Multi-Sample Comparison
Two different glass fiber samples were compared using Feret Width and Feret Length overlays. The comparison showed that Sample 1 had slightly wider particles on a number-based distribution and longer particles by Feret Length than Sample 2. Aspect ratio overlays confirmed the dimensional differences between the two lots. This kind of direct overlay comparison is not meaningful using size-only instruments, where ECA diameter alone would not reveal the geometric distinction between the samples.
Supporting Video
A demonstration of glass fiber analysis is available at: https://www.youtube.com/watch?v=wRAn4r5BmDs
Conclusion
Dynamic Image Analysis with the Raptor BenchTop provides a comprehensive characterization of long glass fibers that size-only instruments cannot match. Thumbnail review delivers qualitative confirmation of fiber morphology, while Feret-based shape parameters, correlation plots, particle classification, and multi-sample overlays provide the quantitative foundation needed for incoming quality control and lot-to-lot comparison.
For related fiber characterization applications, see AN-001 Fiber Particle Shape Analysis and AN-017 Cellulose Fiber Shape Analysis.